Download
1 / 32
320 likes | 484 Views
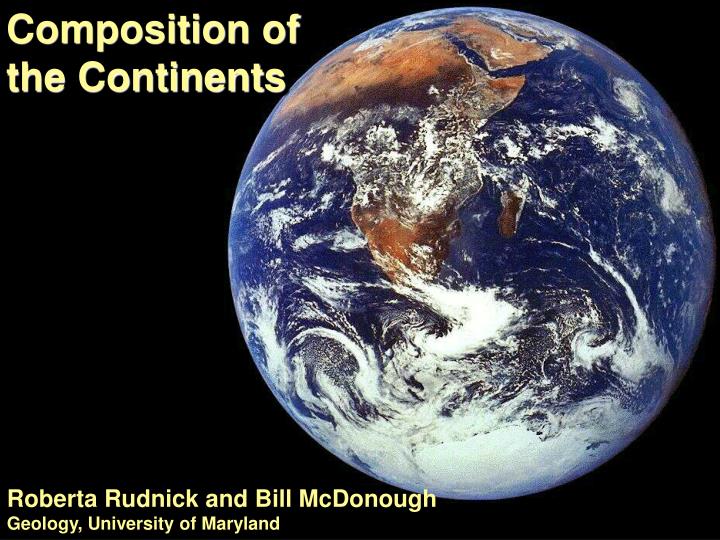
Composition of the Continents. Roberta Rudnick and Bill McDonough Geology, University of Maryland. Oceanic crust <<200 million years old. Continents up to 3500 million years old. ages (Ga). <0.6. 06.-2.6. >2.6. Crustal model 5.1 – 5 º x 5 º grid. Mooney, Lasker and Masters (1998).

E N D
Composition ofthe Continents Roberta Rudnick andBill McDonough Geology, University of Maryland
Continents up to 3500 million years old ages (Ga) <0.6 06.-2.6 >2.6
Crustal model 5.1 – 5º x 5º grid Mooney, Lasker and Masters (1998)
Continental Heat Flow : example from Canadian Shield Perry et al (2006)
Continental Crust’s contribution . . . Mass % Earth’s K, Th & U >40% 0.57% . . . is insignificant in terms of mass, but is a major reservoir for incompatible elements
How is crust composition determined? What is its significance?
Story is in the Upper crust • Its composition is constrained from • surface sampling (e.g., Canadian Shield) • Major elements • Soluble elements • Eade & Fahrig, 1971, 1973; • Shaw et al. 1967, 1976, 1986; • Gao et al., 1998
Insoluble elements from clastic sediments 10.0 Soluble Moderately soluble Na 8.0 Mg K Insoluble U B Re Sr Au Li 6.0 Ca Se Rb Mo Sb t W As Cs Cd Tl Bi Si Ag 4.0 log V Ge Ba Cr Ta increasing solubility Hf Ni Zn In Nb Cu Ga Zr Ti Sn 2.0 Y Be Pb Mn Th Sc Co Al REE 0.0 Fe -2.0 -10.0 -8.0 -6.0 -4.0 -2.0 0.0 sw log K From Taylor & McLennan, 1985 y
1000 Shale composites and Loess Australia N. America Europe Eastern China 100 Chondrite Normalized 10 loess 1 La Ce Pr Nd Sm Eu Gd Tb Dy Ho Er Tm Yb Lu
Loess -- insoluble elements 14 Th 12 Taylor & McLennan 10 Rudnick & Gao (ppm) 8 Gao et al. 6 4 r2 = 0.82 2 10 15 20 25 30 35 40 La (ppm)
4.0 3.0 2.0 1.0 0.0 10 15 20 25 30 35 40 Loess -- soluble element (K) K2O Taylor & McLennan Rudnick & Gao Gao et al. r2 = 0.15 La (ppm)
14.0 12.0 10.0 8.0 6.0 4.0 2.0 0.50 1.0 1.5 2.0 2.5 3.0 3.5 4.0 Loess -- soluble element (U) Th/U = 6 5 4 3 Rudnick & Gao Taylor & McLennan Gao et al. Th (ppm) U(ppm)
Deep crust composition from: • Analyses of deep crustal rocks: • Crustal cross sections • Metamorphic terrains • Xenoliths • Seismic velocities • Surface heat flow
Granulite Facies Terrains Granulite Facies Xenoliths
The beauty of xenoliths • Direct sampling of deep lithosphere: • composition • age • temperature • thickness • deformation • fluids “The poor man’s drill hole”
90 80 Granulite Facies Terrains Archean Post-Archean 70 60 50 40 30 20 10 30 40 50 60 70 80 90 90 80 70 60 50 40 30 20 10 30 40 50 60 70 80 90 Mg# Lower crustal xenoliths Mg# SiO2 (wt. %)
Seismic Constraints Paleozoic Orogen Rifted Margin Rift Arc Contractional Shield & Platform Extensional Forearc 0 20 40 Vp 60 Km 6.4 6.6 6.8 7.0 7.2 Rudnick & Fountain, 1995
Weaver & Tarney Rudnick & Fountain heat producing elements Rudnick & Gao Wedepohl Gao et al. Taylor & McLennan 1000 100 10 1 Models of the Bulk Continental Crust mantle normalized Rb Th K La Pb Sr Zr Sm Ti Ho Cs Ba U Nb Ce Pr Nd Hf Eu Y Yb
Heat Flow Data … SNO+ • Qs Tmoho Perry et al (2006) JGR Crustal heat production … Canadian Shield
Heat production “Moho” Lithosphere (strong layer) and Asthenoshpere (weak layer) Lithosphere: crust + mechanically couple mantle Lithosphere: sits on the asthenoshpere
lithospheric thickness How thick is the lithospheric lid? 2 Surface heat flow = 40 mW/m Where are the HPE? Moho Mantle 50 adiabat no HPE in lithopshere 100 1 150 Depth (km) 200 2 3 4 5 250 all crust 300 350 500 1000 1500 2000 o Temperature ( C)
Jericho Lac de Gras Torrie Grizzly Archean lithosphere is thick & cold Africa Canada 0 Kalihari Slave 50 2 Kalihari geotherm Best Fit (44 mWm-2) 100 4 Pressure (GPa) 150 Depth (km) 6 200 Lesotho Kimberley 8 250 Letlhakane 300 10 200 600 1000 1400 200 600 1000 1400 Temperature (oC) Temperature (oC) From Rudnick &Nyblade, 1999
Heat flow constraints Crustal Model A (µWm-3) Shaw et al. (1986) 1.31 Wedepohl (1995) 1.25 Rudnick & Fountain (1995) 0.93 Gao et al. (1998) 0.93 Weaver & Tarney (1984) 0.92 Rudnick & Gao (2003) 0.89 McLennan & Taylor (1996) 0.70 Taylor & McLennan (1985) 0.58 Total Cont.0.79-0.99
Heat flow constraints Crustal Age A* % Area (µWm-3) Archean 0.56-0.73 9 Proterozoic 0.73-0.90 56 Phanerozoic 0.95-1.21 35 Total Cont. 0.79-0.99 *heat production Jaupart & Mareschal, 2003
Bulk Crust K, Th & U from heat flow K2O 1.3-2.1 wt.% Th 4.7-6.8 ppm U 1.05-1.55 ppm Assuming: Th/U = 3.8 to 5.0 K/U = 10,000 to 13,000
0 20 40 60 80 100 K, Th, U in Upper crust min. max. K2O Th U % Total Crust Budget
Summary: • Deep crust composition • Uncertainties are great • Increasingly more mafic with depth • Incompatible element depleted relative to upper crust
Conclusions: crust composition Composition of the upper crust is known to ±20% for many elements Deep crust is more poorly known Incompatible elements are mainly concentrated in the upper crust Therefore uncertainties in bulk crust reflect upper crustal uncertainties Heat flow constrains bulk crust K, Th and U to ± 50%
b- decay “wish list” Isotope Emax (MeV) natural abundance half life 40K 1.31 0.012% 1.3E9 y 1.51 electron capture- monoenergetic nue- BR 11% 87Rb 0.28 28% 4.9E10 y 138La 1.04 <0.1% 1.05E11 y 1.74 electron capture- monoenergetic nue- branching ratio? 176Lu 1.19 2.6% 3.8E10 y 187Re 0.003 63% 4.4E10 y