Download
1 / 29
290 likes | 560 Views
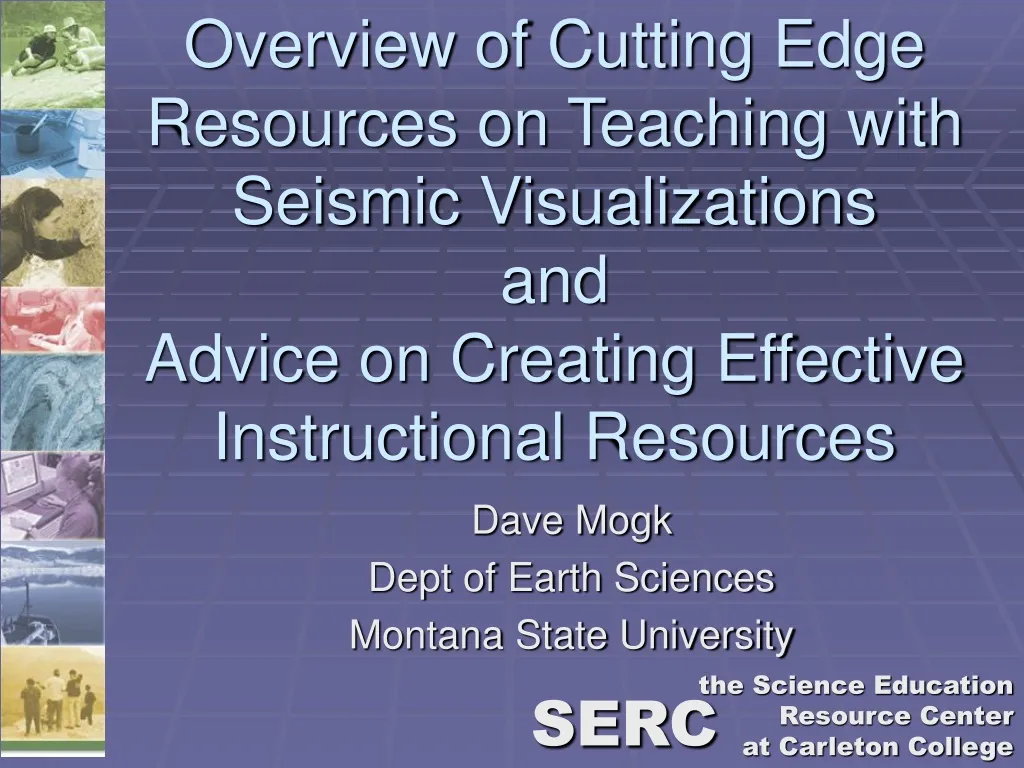
Overview of Cutting Edge Resources on Teaching with Seismic Visualizations and Advice on Creating Effective Instructional Resources. Dave Mogk Dept of Earth Sciences Montana State University. the Science Education Resource Center at Carleton College. SERC. http://serc.carleton.edu/15495.

E N D
Overview of Cutting Edge Resources on Teaching with Seismic Visualizationsand Advice on Creating Effective Instructional Resources Dave Mogk Dept of Earth Sciences Montana State University the Science Education Resource Center at Carleton College SERC
Virtual workshops: Our experiment in broadening our reach, and making it possible for colleagues to participate from their own workspace; building virtual communities. Your feedback is appreciated!
One of the primary goals of this workshop is to create a comprehensive visualization collection on seismic waves. We’ll help you identify topics, respond to instructional needs, and either locate or create the teaching resources we need.
We also want to develop teaching activities that are built around seismic visualizations. These are made available for discovery using ActivitySheets that describe the full context of the activity.
We also would like to develop a series of tutorials, that define the underlying principles, and then provide step-by-step instructions for students to either create their own visualizations from data, or to appropriately interpret data products from other sources
Visualizations in the Geosciences Geoscience is a highly visual field, and effective use of visual tools can enhance student learning, appeal to students’ emotions and help them acquire skills for interpreting visual information. This requires: • The appropriate visual tool • Applying it effectively in the classroom
What are different ways faculty use visualizations in the classroom? Presentation in lecture, illustrated example Interactive lecture – a visualization is paired with a think-pair-share, minute paper, concept test, or “clicker” question. Lab activity – students are guided through an activity where they use visualizations to look at data sets and explore spatial or temporal relationships Independent exploration – students follow instructions on their own, often guided by questions provided by the instructor Reflection/synthesis – students create a visualizations to confirm or verify concepts, content Assessment – Visualizations are part of a problem set or exam, especially after they have already seen something similar in class or lab.
Pedagogic Reasons for Using Visualizations Supports inquiry and discovery Permits observation of the unobservable Renderings showing 3 dimensions or changes over time make complex processes much easier to understand Visualizations allow students to construct their own mental images that promote long-term learning A data discovery, organization, and distribution tool for research projects Visualizations are cool! (A strong affective response!) BUT….
Big take home message: students don’t see what you see Frequency distribution of particles in the atmosphere by size as developed by Whitby (1978). Classroom scenario described by Perry Samson, Univ. Michigan. • Geoscientists (you) have sophisticated spatial reasoning skills • Mental models of processes • Familiarity with reading maps, contours, scales • Geography knowledge • Looking and seeing are learned skills. • The knowledge you bring to the image affects your experience with it. • All of this improves with guided practice.
1. Clearly articulate the learning goals and expected outcomes • Goals and learning outcomes • Content or concept mastery? • Skill development? • Affective (motivation, curiosity, overcoming barriers…) • Higher order thinking skills, life-long and purposeful learners • Determine what constitutes acceptable evidence of competency in the outcomes and results (assessment). • Plan instructional strategies and learning experiences that bring students to these competency levels. (Wiggins and McTighe, 2005; Understanding by Design)
2. Students don't always see what faculty are seeing when viewing a visualization.Just as in other aspects of learning, what students see and learn is built on what they already know. Understanding what students know and see can be addressed on four levels: • Cognitive: what do students focus on in a visualization? • Educational: how does the visualization build on what they already know? • Geoscience: how do students understand and interpret the processes that are represented? • Affective: how does the visualization make students feel?
2. (continued) How can we better align what we want students to see with what they are actually seeing? Map the structure and content of the information to be conveyed on the structure and content of the diagram. Use extra-pictorial devices like arrows and guidelines unambiguously. Craft diagram to explain, not just show. Check to see if students learn what is intended; embed assessments Extraneous detail can interfere with learning (Barbara Tversky, On the Cutting Edge workshop)
*Over-simplification can create misconceptions *Realism is helpful is some cases 3. Simple is usually* better.The power of visualizations comes from their ability to clarify relationships rather than from reproducing exactly the natural world. Thus, a design which emphasizes the desired relationships or information is likely to be more successful than one that makes every effort to be realistic. Students can become confused when elements of a diagram closely resemble the actual entity they represent in the real world (Uttal et al., 2006).
4. Context is important and is easily lost.Effective visualizations maintain the contextual relationships between the different parts of the visualization and between the visualization and whatever it represents. For example, when a series of diagrams are used to explain a process, it is important to keep the student aware of how each step in the progression relates to the overall process.
5. Visualizations are most effective if their organization reflects the mental organization that the student is creating. For example, if students create a series of still images in their mind to represent a geologic process, a series of still images will be most effective in conveying information. Similarly, if students create a mental movie, an animation may be more effective. (Tversky et al., 2002 )
6. Guided discovery helps. Open-ended discovery should be reserved for more sophisticated instruction.Visualizations present a large number of relationships at a single time. Visual or textual clues can focus attention on meaningful items or guide the learner through the visualization in a particular order.
Building Seismic Visualization Teaching Collections • SERC • 3 Million unique visitors; 100,000 repeat visitors (5+), multiple page visits (10+), 20+ minute dwell time • On the Cutting Edge • 50% US Geo faculty are aware of and use CE; 12,000 multiple page visitors (5600 Geo faculty in US…so we’re reaching a much larger audience • Benefits of building collections in this environment • Dedicated audience • Advanced search/browse • Repurposing of materials for multiple pathways to discovery • Linkages to full range of related resources • Assessment, Visualization, Affective Domain, Metacognition, Research on Learning….
Seismic Visualizations for use Across the Geoscience Curriculum • What is needed: • Tutorials, with step-by-step instructions for teachers about how to create their own visualization exercises • Collections of teaching activities using seismic visualizations; • aggregated, organized, reviewed • Special thematic collections • Image collections
Developing the Collections • We provide web authoring services in our CMS • Context • Community needs • Linking Science, pedagogy, teaching activities, assessments, research on learning • Search/browse; controlled vocabularies and free text • Learning objects contain essential background information, annotations, related resources… • Confidence • Useful materials will be found • Reviewed (scientific veracity, pedagogic effectiveness, robustness—it works) • Community of users/contributors
Please Contribute • Content from your Site/Project • We create ActivitySheets to provide context and to aid discovery • EVERY RESEARCH PROJECT CAN DEVELOP AN INSTRUCTIONAL MODULE!!! • You get an added “broader impact” • We can develop/hold content for you • Web authoring services • To Submit an Activity http://serc.carleton.edu/NAGTWorkshops/geophysics/activity-submission.html