Download
1 / 13
130 likes | 451 Views
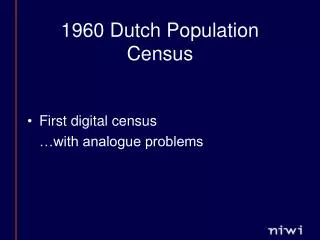
The Dutch Censuses of 1960, 1971 and 2001 Producing public use files in the IPUMS project. Wijnand Advokaat Statistics Netherlands Division Social and Spatial Statistics WADT@CBS.NL Presentation in July 2005. Contents. Introduction Statistics Netherlands History of the Dutch Census

E N D
The Dutch Censuses of 1960, 1971 and 2001Producing public use files in the IPUMS project Wijnand Advokaat Statistics Netherlands Division Social and Spatial Statistics WADT@CBS.NL Presentation in July 2005
Contents • Introduction Statistics Netherlands • History of the Dutch Census • Introduction Virtual Census of 2001 • Combining data sources: micro-linkage • Combining sources: micro-integration • Preliminary work • Harmonisation • More information about the Dutch Censuses • Conclusions
Introduction Statistics Netherlands (1) • The Central Statistical Office (CBS) • (no regional offices) • Statistics Netherlands wants to compile and publish undisputed, coherent up-to-date statistical information that is relevant for practice, policy and research • More about Statistics Netherlands: • exists since 1899 • since 3 January 2004 semi-independent organisation (still government funding) • more than 2000 employees • two buildings (Voorburg in the West and Heerlen in the South)
Introduction Statistics Netherlands (2) • Central Commission for Statistics (CCS) • Independent body to assess and decide on our work programme • No direct influence by the government • Members of the CCS: • Employer organisations • Trade Unions • Universities and other research institutes • Members of parliament • Ministries
Introduction Statistics Netherlands (3) • Statistics Netherlands’ organisation: • Executive board and central departments (300 employees) • Division of Business Statistics (740 employees) • Division of Social and Spatial Statistics (450 employees) • Division of Macro-economic Statistics and Dissemination (440 employees) • Division of Technology and Methodology (380 employees) • More information about Statistics Netherlands: • Our English website: http://www.cbs.nl/en/ • StatLine: link on the homepage
History of the Dutch Census • TRADITIONAL CENSUS • Ministry of Home Affairs: • 1829, 1839, 1849, 1859, 1869, 1879 and 1889 • Statistics Netherlands: • 1899, 1909, 1920, 1930, 1947, 1960 and 1971 • Unwillingness (non-response) and reduction expenses no more Traditional Censuses • ALTERNATIVE: VIRTUAL CENSUS • 1981 and 1991: Population Register and surveys • development 90’s: more registers → • 2001: integrated set of registers and surveys, SSD
Introduction Virtual Census of 2001 • Why a Census? • Statistical information for research and policy purposes • What kind of information? • Size of (sub)population(s) • Demographic and socio-economic characteristics, at national and regional level • Gentlemen’s agreement • Eurostat: co-ordinator of EU, accession and EFTA • countries in the 2001 Census Round • Census Table Programme, every 10 years
Combining sources: micro-linkage • Linkage key:RegistersSocial security and Fiscal number (SoFi), uniqueSurveys Sex, date of birth, address (postal code and house number) • Linkage key replaced by RIN-person • Linkage strategyOptimizing number of matchesMinimizing number of mismatches and missed matches
Combining sources: micro-integration • Collecting data from several sources more comprehensive and coherent information on aspects of person’s life • Compare sources - coverage - conflicting information (reliability of sources) • Integration rules • - checks - adjustments - imputations • Optimal use of information quality improves • Example: job period vs. benefit period
Preliminary work • Census Programme definitions:not always clear and unambiguous, e.g. economic activity • Priority rules • (characteristics of) main job (highest wage) • employee or employer • job or (partially) unemployed • job or attending education • job or retired • engaged in family duties or retired • age restrictions • One percent samples for all three years • Weighting to population totals • Protecting according to rules for • public use files
Harmonisation • For 1960 and 1971 the same variables as for 2001 • if not available: constructed based on existing variables in Census data • International classifications • ISIC / NACE • ISCO-COM • ISCED • Variables not internationally harmonised • same classification and priority rules as for 2001
More information about the Dutch Censuses • 1960: http://www.volkstelling.nl/nl/documentatie/1960/ • 1971: http://www.volkstelling.nl/nl/documentatie/1971/ • 2001 tables: http://www.cbs.nl/en/publications/articles/general/census-2001/census-2001.htm • 2001 book: • http://www.cbs.nl/en/publications/recent/census-2001/b-57-2001.htm
Conclusions • The Dutch Virtual Census of 2001 was successfulPro’s: relatively cheap (cost per inhabitant) • and quick • Con’s:publication of small subpopulations • sometimes difficult or even impossible • because of limited information • Microdata for three years (1960, 1971 and 2001) now ready for research!