Download
1 / 24
240 likes | 433 Views
Labor Force Statistics. An employed person is a person over age 16 who:. Is not in the military, in prison, or in some other institution. AND. Worked at least one hour in the past week as a paid employee OR Worked at least one hour in the past week for his/her own farm or business OR

E N D
Labor Force Statistics • An employed person is a person over age 16 who: Is not in the military, in prison, or in some other institution AND Worked at least one hour in the past week as a paid employee OR Worked at least one hour in the past week for his/her own farm or business OR Worked at least 15 hours as an unpaid employee of a family business OR Did not work in the previous week but had a job from which he was absent due to vacation, illness, bad weather, childcare problems, family leave, labor-management dispute, job training, or other family or personal reasons
Labor Force Statistics • An unemployed person is a person over age 16 who: Was not employed during the past week AND Was available to work during the past week OR Was temporarily ill but would otherwise have been available to work AND Made specific efforts to find employment sometime in the past 4 weeks OR Was waiting to be recalled from a job from which he/she had been laid off
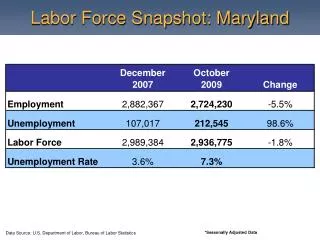
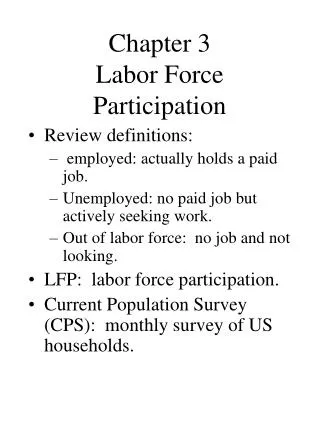
Labor Force Statistics • More definitions • Employment is equal to the number of employed persons. • Unemployment is equal to the number of unemployed persons. • The labor force is equal to the number of persons who are either employed or unemployed: • The unemployment rate is equal to employment divided by the labor force: Labor force = employment + unemployment
Labor Force Statistics • More definitions • A person who is not in the labor force (NILF) is a person over age 16 who is not in the military, not in prison or some other institution, and who is neither employed nor unemployed • Ex: retired individuals, disabled individuals are NILF • A discouraged worker is a person who is NILF but wants a job, is available for a job, and has either worked or looked for work in the past 12 months, but is no longer looking for work because he/she believes that there are no jobs available for him or her • The civilian noninstitutional population (CNP16+) is equal to the number of persons over age 16 who are not in the military, in prison, or in some other institution: Civilian noninstitutional population = labor force + persons NILF
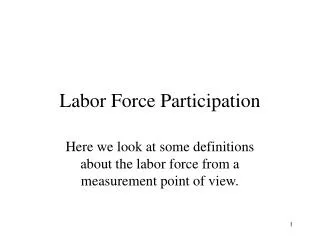
Labor Force Statistics • More definitions • The labor force participation rate is the labor force divided by the civilian noninstitutional population: • All of the above definitions are technical terms set by the Bureau of Labor Statistics (BLS) of the U.S. Department of Labor • Values of the above variables can be found at http://www.bls.gov
Unemployment Rate, 1947-2001 Source: Bureau of Labor Statistics
LF Participation Rate, 1947-2001 Source: Bureau of Labor Statistics
Labor Force Statistics • Estimating labor force statistics • The Current Population Survey (CPS) is a survey conducted by the BLS and by the Bureau of the Census • Calls or visits 50,000 households each month, interviews 140,000 individuals a month as a result • Labor force questions are asked of as many individuals in the survey over the age of 16 as possible • The responses of the approx. 110,000 individuals over age 16 surveyed are used by the BLS to estimate the unemployment rate, labor force participation rate, etc. of all 270,000,000 Americans • Unemployment rate believed to be correct within 0.2% • CPS data available to public at http://ferret.bls.census.gov
Kinds of Unemployment • Reasons for unemployment • Frictional unemployment is the number of people who are unemployed not because they cannot find any job at all, but rather because they are passing up available jobs because they believe a longer job search will result in their finding a better job later on • Sometimes called “search” unemployment • Exists because of imperfect information in labor markets, ideal matching of job seekers with job vacancies is not instantaneous • The frictionally unemployed are voluntarily unemployed, believe that a lengthier period of unemployment will make them better off in the long run because it allows lengthier job search • Considered a “healthy” kind of unemployment for an economy
Kinds of Unemployment • Reasons for unemployment • Structural unemployment is the number of people who are unemployed because of changes in the structure of the economy • Ex.: If industries shift their operations from the North to the South, jobs decrease in the North, unemployment increases in the North; “regional imbalance” in labor markets • Ex.: If technology improves and production shifts from a low-technology, low-skill environment to a high-technology, high-skill environment, unemployment increases among low-skill workers; “occupational imbalance” in labor markets • Also considered a “healthy” kind of unemployment because it is a side effect of often positive changes in the economy
Kinds of Unemployment • Reasons for unemployment • Cyclical unemployment is the no. of people who are unemployed for reasons other than frictional or structural unemployment: Cyclical Unemp. = Total Unemp. – Frictional and Structural Unemp. • Often attributed to a failure of aggregate product demand: people, firms and the government are not buying goods and services, firms do not need workers to produce goods and services and do not offer jobs to all willing and available job applicants • Sometimes called “demand-deficit unemployment” • Not considered healthy for an economy; the cyclically unemployed are people willing and able to work who are idle for no reason that benefits either the unemployed person or the economy as a whole
Kinds of Unemployment • The “natural rate of unemployment” • The natural rate of unemployment is the unemployment rate that would prevail if all unemployment was frictional or structural • Cannot be measured precisely but educated guesses can be made • Was approximately 4% during the 1950’s and 1960’s, 6% during the 1970’s and 1980’s, and back to 4% for the 1990’s and 2000’s • Long-term changes in the unemployment rate are attributable to changes in frictional and structural unemployment, and consequently to changes in the natural rate of unemployment • Short-term changes in the unemployment rate are attributable to changes in cyclical unemployment; natural rate of unemployment stays the same through short-term changes in unemployment rate
Kinds of Unemployment • The “natural rate of unemployment” • Ex.: Increase in average yearly unemployment rate from 4.8% over 1960-69 to 6.2% over 1970-79 likely due to change in frictional and structural unemployment; natural rate of unemployment likely lower in 1960-69 (approx. 4%) than in 1970-79 (approx. 5.5%) • Note natural rate of unemployment in a decade not the same as average rate of unemployment in a decade • Ex.: Increase in unemployment rate from 5.6% in 1974 to 8.5% in 1975 likely due to change in cyclical unemployment; natural rate of unemployment likely same in 1974 as in 1975 (approx. 5.5%) • When cyclical unemployment rises for more than ½ year, some say economy is in recession; rest of time, economy is in expansion
Unemployment Rate, 1947-2001 • Trend change in unemployment (red line): change in frictional and structural unemployment • Fluctuations around that trend: change in cyclical unemployment • When deviation from trend is great, so is cyclical unemp. Source: Bureau of Labor Statistics
Unemployment Rate, 1947-2001 • Ex.: In 1982, unemployment much greater than trend, cyclical unemployment great • Ex.: In 1988, unemployment much less than trend, cyclical unemployment slight 1982 1988 Source: Bureau of Labor Statistics
Kinds of Unemployment • Controlling cyclical unemployment • Cyclical unemployment can be reduced with expansionary fiscal policy (increasing government spending or cutting taxes) or expansionary monetary policy (reducing interest rates by manipulating the money supply): see any macro text for details • Cost of reducing cyclical unemployment with expansionary fiscal or monetary policy is higher inflation rate • Expansionary fiscal or monetary policy pursued if enjoying lower unemployment rate is worth tolerating higher inflation rate • Expansionary fiscal or monetary policy wisest when unemployment is unusually high (>7%) and inflation is low (<3%)
Kinds of Unemployment • Controlling cyclical unemployment • Cyclical unemployment is usually increased by contractionary fiscal policy (reducing government spending or increasing taxes) or contractionary monetary policy (increasing interest rates by manipulating the money supply): see any macro text for details • Value of increasing cyclical unemployment with contractionary fiscal or monetary policy is lower inflation rate • Contractionary fiscal or monetary policy pursued if enjoying lower inflation rate is worth tolerating higher unemployment rate • Contractionary fiscal or monetary policy wisest when unemployment is low (<5%) and inflation is unusually high (>6%) • Fiscal, monetary policy trade-off between inflation, unemployment
Unemployment Insurance (UI) • Relieving unemployment • All 50 states have unemployment insurance (UI) programs designed to provide relief for unemployed individuals • UI makes regular payments to unemployed people equal to a percentage of what they earned when they were employed • The more you earned when you were employed, the greater the monthly UI payments you receive when you are unemployed • Unemployed people only qualify for UI if they had, prior to their unemployment, been employed for a reasonable length of time • Limits on length of time unemployed people can receive UI, size of periodic UI payments unemployed people can receive, total UI payment people can receive over entire unemployment spell
Unemployment Insurance • Michigan UI program • Michigan UI recipients receive weekly UI benefit of approx. 50% of what they earned in a typical week when they were employed • Ex.: UI recipient who earned $300/week in wages when employed receives approx. $150/week in benefits when unemployed • Ex.: UI recipient who earned $600/week in wages when employed receives approx. $300/week in benefits when unemployed • Maximum weekly UI benefit is $300 • Ex.: UI recipient who earned $900/week in wages when employed receives $300/week in benefits when unemployed • Only unemployed people who had worked for pay for approx. 50% of previous year can collect benefits
Unemployment Insurance • Michigan UI program • UI benefits over entire spell of unemployment cannot exceed approx. 40% of what UI recipient earned while employed over previous year • Ex.: UI recipient who earned $6,000 total in previous year cannot receive more than $2,400 in UI benefits total while unemployed • UI recipients cannot receive UI benefits for more than 26 weeks • Above description of Michigan’s UI program heavily stylized; actual laws and rules regarding UI benefits in Michigan more complicated than above, hence the approximatelys • UI benefits, like wages, subject to federal income tax since 1979
Unemployment Insurance • Unemployment Insurance and Unemployment • Does the generosity of UI benefits reduce the incentive of the unemployed to take jobs and become employed again? • Idea behind above question: UI benefits may make unemployment more tolerable, may make unemployed people more willing to tolerate long spells of unemployment, and may make unemployed people more willing to pass up available jobs and stay unemployed in hopes that an even better job will come around • I.e.: If UI benefits are reduced, do the unemployed take jobs sooner? Does the average spell of unemployment become shorter? • Taxing of UI benefits starting in 1979 offers some evidence about the answer to this question
Unemployment Insurance • Unemployment Insurance and Unemployment • When UI benefits first made subject to federal income tax in 1979, the tax only applied to people with total yearly adjusted gross incomes (including wages and UI benefits) of $20,000 or more • Consequently, in 1979, unemployed individuals with total incomes greater than $20,000 experienced a reduction in UI benefits due to tax while those with total incomes of less than $20,000 did not • “Natural experiment”: Did the unemployment spells of people whose UI benefits were reduced by the tax (those w/incomes > $20K) become shorter relative to unemployment spells of people whose UI benefits weren’t taxed at all (those w/incomes < $20K)? • If yes, then UI benefits probably do lengthen unemployment spells
Unemployment Insurance • Unemployment Insurance and Unemployment • Gary Solon (U. of Michigan) analyzed U.S. DoL data about UI recipients in Georgia in 1978 (before UI benefits were taxed) and in 1979 (after UI benefits were taxed for some but not all) • Found that unemployment spells of UI recipients whose UI benefits were taxed become shorter relative to unemployment spells of UI recipients whose benefits were not taxed:
Unemployment Insurance • Unemployment Insurance and Unemployment • Solon’s results imply that reducing the generosity of UI benefits has advantage of increasing the incentive of the unemployed to become employed sooner, probably because lower UI benefits makes unemployment less tolerable, employment more desirable • But reducing the generosity of UI benefits also has the disadvantage of lowering the quality of life of the unemployed: with less benefits, unemployed less able to pay for food, rent, etc. • Similarly, increasing generosity of UI benefits has the advantage of improving the quality of life of the unemployed but also the disadvantage of reducing their incentive to become employed • UI policy trade-off between work disincentive and quality of life