Download
1 / 15
150 likes | 334 Views
Workflow Analysis of Student Data. John R. Gilbert and Viral Shah. Goals and Caveats. Our goal is to develop methods for using measured data to evaluate hypotheses about workflow. These are preliminary experiments using data from one pilot classroom study (UCSB CS240A, spring 2004).

E N D
Workflow Analysis of Student Data John R. Gilbert and Viral Shah
Goals and Caveats • Our goal is to develop methods for using measured data to evaluate hypotheses about workflow. • These are preliminary experiments using data from one pilot classroom study (UCSB CS240A, spring 2004). • Don’t put too much trust in this data! (We are still learning what data to gather and how.) • Therefore, this talk won’t defend any particular conclusions about workflows. Rather, we aim to: • show that a data-based analytical approach is promising for further development • inform data-gathering in upcoming studies.
Background • System asked student for a reason for each compile • We didn’t trust the answers . . . • But we captured full source etc. at each compile & run • So, we completely re-ran the student experience • here, one assignment from one class • 17 student histories • about one day of 32-processor cluster time • Used heuristics to assign reasons for compiles …
Scripted questionnaire • What is the reason for this compile/run? • Learn / experiment with compiler • Adding serial functionality • Parallelizing • Performance tuning • Fixing compile time error • Fixing run time error
Heuristics to deduce answers • What is the reason for this compile/run? • Learn / experiment with compiler Few MPI calls, LOC ~unchanged • Adding serial functionality Few MPI calls, LOC changes • Parallelizing # of MPI calls changes • Performance tuning Correct, run time changes • Fixing compile time error Previous compile failed • Fixing run time error Previous run failed on random test case • More than one reason may match.
Example of student trace Student #2: 70 runs in 7 days, 12 hr, 0 sec rev 1 after 0s: [ seq ] [ runerr ] rev 2 after 4d 4h 27m 7s: [ seq par ] [ cplerr ] rev 3 after 41s: [ seq ] [ cplerr ] rev 4 after 19s: [ ] [ cplerr ] rev 5 after 21s: [ ] [ cplerr ] . . . . . . . . . . . . rev 14 after 21m 49s: [ ] [ cplerr ] rev 15 after 6m 32s: [ seq ] [ cplerr ] rev 16 after 38s: [ seq ] [ run ], time=7.47479 rev 17 after 57s: [ seq ] [ run ], time=4.58393 rev 18 after 2m 25s: [ ] [ run ], time=7.68748 rev 19 after 1m 14s: [ ] [ run ], time=4.54306 . . . . . . . . . . . . rev 64 after 2m 22s: [ par ] [ runerr ] rev 65 after 5m 0s: [ par ] [ crash ] rev 66 after 6m 43s: [ ] [ run ], time=10.6737 rev 67 after 2m 30s: [ ] [ run ], time=3.22613 rev 68 after 55s: [ ] [ run ], time=2.94095 rev 69 after 29s: [ ] [ run ], time=9.04667 rev 70 after 46m 2s: [ ] [ run ], time=3.10115
Summary of student experience Student # 1: 324 runs in 22h 41m 37s best = 3.386 Student # 2: 70 runs in 8h 35m 11s best = 2.346 Student # 3: 36 runs in 4h 59m 54s best = 1.854 Student # 4: 216 runs in 11h 42m 54s best = 6.509 Student # 5: 173 runs in 14h 57m 35s best = 5.459 Student # 6: 122 runs in 8h 27m 10s best = 2.606 Student # 7: 174 runs in 18h 17m 8s best = 3.576 Student # 8: 536 runs in 27h 10m 16s best = 7.540 Student # 9: 72 runs in 17h 23m 32s best = 5.533 Student #10: 110 runs in 11h 43m 29s best = 5.183 Student #11: 325 runs in 41h 18m 12s best = 1.684 Student #12: 188 runs in 18h 24m 39s best = 4.428
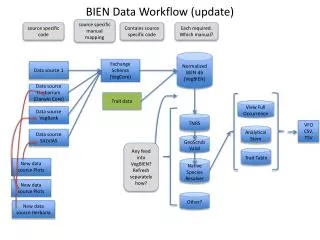
Compiles, Runs, Correct runs • Distribution varies significantly by programmer
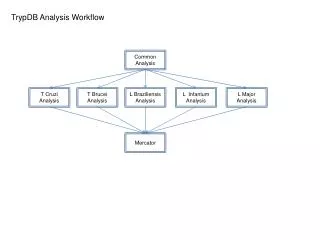
LOC profiles • All kinds of workflows are observed in the class
State A State B prob(B | A) / time(A | B) Timed Markov processes • A timed Markov process is a Markov process with associated state dwell times • The dwell times depend on how the state is exited • prob(B | A) is the probability the next state is B given that the current state is A • time(A | B) is the dwell time spent in state A given that the next state is B • The dwell time is a random variable in general From Burton Smith and David Mizell, CRAY
General model of researcher workflow • express new scientific theory in informal notation • express new theory in VHLL (Matlab, Perl, OS360 JCL, etc.) • debug code on small data sets • test new theory on small, medium data sets -- compare against known results, previous models • redesign program for HPC system • write program for HPC system • compile for debug • test HPC code • debug HPC code • select medium-to-large data set for performance testing/optimization • optimize HPC code for performance • do performance test run for HPC code • select, obtain large-scale data set • structure data set for large-scale computation • test large-scale data set arrangement for correctness • test for expected performance • design/implement visualization approach for larger-scale problems • run performance-tuned version against large-scale data set • visualize results • revise control parameters • select new data set Items in red: new system could shorten time – we’ll try to model these Items in orange: could also be sped up by new system, but not yet part of model From Burton Smith and David Mizell, CRAY
Formulate 1/Tf 1/Tp Program 1/Td Compile Debug qdpp/Tt 1/Tc Test pd/Tt qdqp/Tt 1/To Compile Optimize 1/Tc Run po/Tr qo/Tr Researcher workflow model From Burton Smith and David Mizell, CRAY
Fitting data to Cray model Transition probabilities program compile1 test debug run optimize compile2 program 23.7% compile1 100.0% 100.0% test 100.0% debug 71.3% 26.6% run 4.8% 100.0% optimize 69.9% compile2 100.0% done0.2% 3.5% Average dwell times program compile1 test debug run optimize compile2 program 5s compile1 4m 28s 6m 20s test 49s debug 5s 5s run 9s 30s optimize 4s compile2 10m 29s done5s 3s
Fitting data to Cray model Formulate Program 1.0 / 268s 1.0 / 380s Compile Debug .237 / 5s 1.0 / 49s .713 / 5s Test .002 / 5s .048 / 9s 1.0 / 629s Compile Optimize .266 / 5s 1.0 / 30s Run .699 / 4s .035 / 3s
Conclusions • Remember all the caveats! • This is very preliminary, no conclusions about workflows yet • Fitting measured data to hypothesized workflows looks promising • We’re getting better at knowing what to measure and how • See Vic’s talk yesterday • Formulation time, programming vs debugging, . . . ? • Measure automatically when possible • Lots more data coming soon from classroom experiments • Should be able to do this with professional data too • Want to compare different {languages / apps / . . . } • Want to use principled approach to estimating statistics of dwell times, evaluating competing state models, etc.