Download
1 / 62
660 likes | 902 Views
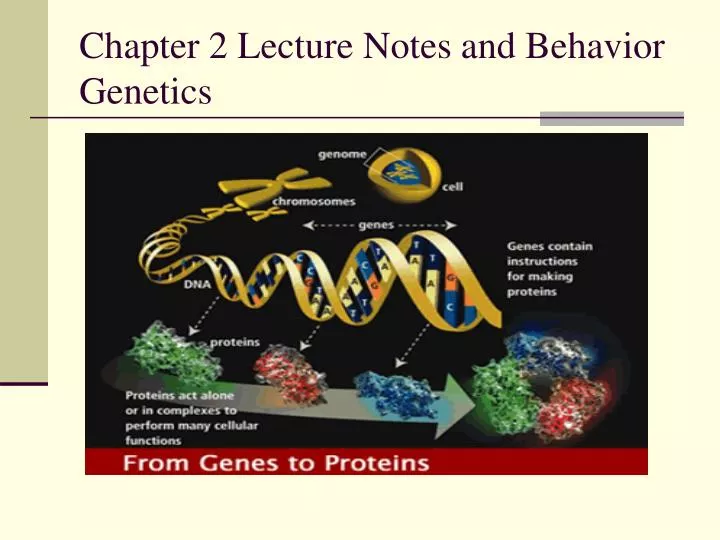
Chapter 2 Lecture Notes and Behavior Genetics. Meiosis. Meiosis: This is division of the germ cells (i.e., the male or female reproductive cells)

E N D
Meiosis • Meiosis: This is division of the germ cells (i.e., the male or female reproductive cells) • The result is that, for a male, the sperm (or egg) cells contain half the number of chromosomes (N=23) that normal cells in other parts of the body contain (N=46). • Meiosis results in sperm (or egg) cells that are a more or less random collection of one each of the chromosomes from Mom and Dad;
Meiosis for a male: His germ cells start out with 23 pairs of chromosomes, one set from mom (m) and one set from dad (d), with crossover for half of germ cells. After Meiosis • Mom Dad Sperm#1 Sperm#2 Sperm #3 Sperm #4 . . . • 1 m d m d mc dc • 2 m d d mc m dc • 3 m d dc m c mc • 4 m d • 5 m d • 6 m d • 7 m d • 8 m d • 9 m d • 10 m d • 11 m d • 12 m d • 13 m d • 13 m d • 14 m d • 15 m d • 16 m d • 17 m d • 18 m d • 20 m d • 21 m d • 22 m d • 23 X Y X Y Y X
Meiosis for a female: Her germ cells start out with 23 pairs of chromosomes, one set from mom (m) and one set from dad (d), with crossover for half of germ cells. After Meiosis • Mom Dad Sperm#1 Sperm#2 Sperm #3 Sperm #4 . . . • 1 m d m d mc dc • 2 m d d mc m dc • 3 m d dc m c mc • 4 m d • 5 m d • 6 m d • 7 m d • 8 m d • 9 m d • 10 m d • 11 m d • 12 m d • 13 m d • 13 m d • 14 m d • 15 m d • 16 m d • 17 m d • 18 m d • 20 m d • 21 m d • 22 m d • 23 X X X X X X
Meiosis • The figure includes crossover: half of the m and d chromosomes interchange genetic material with each other. • These are indicated by mc and dc respectively. • The female germ cell undergoes a similar process, so the actual number of possible genetic combinations between one man and one woman is staggeringly high.
Definitions: Mitosis, Autosome • Mitosis: Normal cell division in non-germ cells. • Mitosis replicates the previous cell unless there are errors. • autosomes: The 22 paired non-sex chromosomes.
Definition: Allele • If the alleles are homozygous, the two genes at the locus are the same. • If the alleles are heterozygous, the two genes at the locus are different.
Definitions: Co-dominant, Dominant, Recessive • Co-dominant: Both alleles at a locus are expressed with equal force; e.g., the ABO blood system: If you are AB, you express both alleles • Dominant: Only one allele at a locus is expressed. The other (recessive gene) is suppressed. • Recessive: An allele that is suppressed in the presence of a dominant gene. If the two recessive alleles occur at a locus, then the trait is expressed.
Definitions: Sex Chromosomes, X-linkage • Sex chromosomes: • The 23rd pair of chromosomes determine sex: Males are XY and females are XX. • Non-sex chromosomes are autosomes • X-linkage: Genes carried on the X-chromosome. • Since males only have one X chromosome, any recessive gene on the X-chromosome will be expressed in males. • In females, such recessive genes may be suppressed by a dominant gene on her other X-chromosome. • X-linkage explains why males are prone to disorders caused by recessive genes on the X chromosome. • Hemophilia is an X-linked disorder.
Definition: Modifier genes • Modifier genes: Genes that influence a trait indirectly. • For example, a dominant gene affects whether people can get early cataracts, but modifier genes determine how serious the cataracts are likely to be. • Often these modifier genes are located on different chromosomes.
Genes work together. • Most traits studied by psychologists are influenced by multiple genes (polygeny) • Most genes influence more than one trait (pleiotropy).
Recessive Genes • Recessive genes are hard to get rid of, even if they are highly deleterious or even lethal. • That's because they are typically masked by dominant genes. • Even if both parents are recessive for a harmful gene like PKU, only 25% of their offspring would be homozygous for the trait.
Recessive and Dominant Genes • What would the above figure look like if only the mother was a carrier? • What would it look like if one parent was homozygous for the recessive gene? • What would happen to all of this if PKU was dominant instead of recessive? • Some disorders are caused by dominant genes. • Huntington's chorea is a lethal gene, but it's effects don't show up until age 35-40. • Why would this type of lethal gene survive in the population?
Heterozygous genes • Some recessives are actually beneficial if the person is heterozygous for the condition. • The example for the latter is Sickle Cell Anemia. • Sickle Cell Anemia benefits people living in areas infested by malaria. • Heterozygotes are superior to either homozygous condition.
Chromosomal disorders: Down syndrome • Chromosomal disorders: • Down syndrome is caused by non-disjunction of the 21st chromosome during meiosis. • As a result, the child has three 21st chromosomes instead of the normal two. • Down Syndrome is a genetic disorder but it is not caused by having a harmful gene
BEHAVIOR GENETICS • Behavior genetics challenges the behaviorist perspective of John Watson who famously wrote: • "Give me a dozen healthy infants, well-formed, and my own specific world to bring them up in and I'll guarantee to take any one at random and train him to become any type of specialist I might select — a doctor, lawyer, artist, merchant-chief and, yes, even into beggar-man and thief, regardless of his talents, penchants, tendencies, abilities, vocations and race of his ancestors."
BEHAVIOR GENETICS • 1.) BEHAVIOR GENETICS STUDIES IDIOGRAPHIC DEVELOPMENT: What combination of genetic and environmental on average affect where people are on the normal curve.
BEHAVIOR GENETICS • 2.) BASIC CONCEPTS:PHENOTYPE = OBSERVABLE OR MEASURABLE CHARACTERISTICS • HAIR COLOR, IQ • GENOTYPE = GENETIC COMPLEMENT OF PERSON • HAVING A RECESSIVE GENE FOR COLOR BLINDNESS • POLYGENY: MANY GENES INFLUENCE A TRAIT BUT NO ONE GENE HAS A MAJOR EFFECT • HUNDREDS OF GENES INFLUENCE IQ ANDPERSONALITY; • Few, if any cause more than 1% of the variation
GENOTYPE → ENVIRONMENT INTERACTIONS: Active • GENOTYPE → ENVIRONMENT INTERACTIONS: WAYS THAT GENETIC TENDENCIES BECOME CORRELATED WITH PARTICULAR ENVIRONMENTS. • 1.) ACTIVE GENOTYPE → ENVIRONMENT INTERACTION (NICHE-PICKING): • CHILD SEEKS OUT ENVIRONMENTS AS A RESULT OF GENETIC INFLUENCES • CHILD WITH A SENSATION SEEKING TEMPERAMENT • The active genotype-environment interaction probably increases in importance as the child grows older. Why?
GENOTYPE → ENVIRONMENT INTERACTIONS: Evocative • 2.) EVOCATIVE GENOTYPE → ENVIRONMENT INTERACTION: CHILD EVOKES ENVIRONMENTS AS A RESULT OF GENETIC INFLUENCES • CHILD WITH A DIFFICULT TEMPERAMENT EVOKES NEGATIVE RESPONSES IN CAREGIVERS; CHILD WITH A SUNNY DISPOSITION GETS POSITIVE RESPONSES.
GENOTYPE → ENVIRONMENT INTERACTIONS: Evocative • 2.) EVOCATIVE GENOTYPE → ENVIRONMENT INTERACTION: CHILD EVOKES ENVIRONMENTS AS A RESULT OF GENETIC INFLUENCES • Children with violent natural parents and children with non-violent natural parents are adopted into separate families, and the adoptive families are compared. • Children with violent natural parents have adoptive parents who use harsh discipline. • Children with non-violent natural parents have adoptive parents who use mild discipline. • This "environmental" effect is the result of an evocative genotype → environment effect: Aggressive, difficult children evoke harsh parenting.
GENOTYPE → ENVIRONMENT INTERACTIONS: Passive • 3.) PASSIVE GENOTYPE ENVIRONMENT INTERACTION: • CHILD IS PASSIVE RECIPIENT OF ENVIRONMENTS WHICH FIT WITH HIS/HER GENOTYPE. • INTELLIGENT PARENTS HAVE CHILD WITH GENETIC POTENTIAL FOR INTELLIGENCE; • PARENTS ALSO PROVIDE A GREAT DEAL OF INTELLECTUAL STIMULATION WHICH MESHES WITH THE CHILD'S GENETIC POTENTIAL.
GENOTYPE → ENVIRONMENT INTERACTIONS: Passive • 3.) PASSIVE GENOTYPE ENVIRONMENT INTERACTION: P g e C P=parent C=Child g=genes e= environment
Shared and Unshared Environmental Influences • SHARED ENVIRONMENTAL INFLUENCES: ENVIRONMENTAL INFLUENCES SHARED BY CHILDREN IN THE SAME FAMILY. • EXAMPLE: CHILDREN IN SAME FAMILY GO TO SAME SCHOOL, HAVE SAME ALCOHOLIC MOTHER OR AFFECTIONATE MOTHER, ETC • UNSHARED ENVIRONMENTAL INFLUENCES: DIFFERENT CHILDREN RECEIVE DIFFERENT ENVIRONMENTS; OR DIFFERENT CHILDREN RESPOND TO THE SAME ENVIRONMENT DIFFERENTLY; • EXAMPLE: DIFFERENT BIRTH ORDER, SEX DIFFERENCES, PEER RELATIONSHIPS
Shared and Unshared Environmental Influences • UNSHARED ENVIRONMENTAL INFLUENCES: DIFFERENT CHILDREN RECEIVE DIFFERENT ENVIRONMENTS; OR DIFFERENT CHILDREN RESPOND TO THE SAME ENVIRONMENT DIFFERENTLY; • EXAMPLE: DIFFERENT BIRTH ORDER, SEX DIFFERENCES • According to Plomin et al. (2001), unshared environmental influences are typically far more important than shared environmental influences. • Notice that the unshared environment idea is linked to the active child concept (Why?) and is used to explain the fact that adoptive siblings and even biologically related siblings are typically not very similar. • As the text says, 'Clearly, researchers in individual differences can no longer assume a homogeneous home environment for all siblings; be alert to this fact when you read the reports and conclusions of such studies.'
Reaction Range: The range of phenotypic expression depending on different environments of different quality.
Reaction Range: Different people have different reaction ranges; they respond differently to the same environments.
Reaction Range for IQ, including abusive environments IQ score ______________________________Abusive Poor Average Enriched Quality of Environment Genotype A Genotype B Genotype C Genotype D
Canalization • CANALIZATION: THE GENETIC RESTRICTION OF A PHENOTYPE TO A SMALL NUMBER OF DEVELOPMENTAL OUTCOMES, PERMITTING ENVIRONMENTAL INFLUENCES TO PLAY ONLY A SMALL ROLE IN THESE OUTCOMES; • Genes restrict the extent to which the environment can influence the phenotype. • A highly canalized phenotype is not much influenced by environmental influences. • A weakly canalized phenotype is open to environmental influences.
Behavior Genetics Methods: Adoption Studies • Adoption Studies: Comparison of adopted children to natural and adoptive families. • Correlations with natural family indicate genetic influence; • correlations with adoptive family indicate environmental influences. • Assumption: environment before adoption does not systematically affect the behavior studied.
Behavior Genetics Methods: Adoption Studies • Findings: Adopted children's IQ scores are correlated with those of their biological parents, indicating genetic influence. • Their IQ scores are also correlated with their adoptive parents at age 7, indicating environmental influence. • However, at age 18, there is no correlation between adopted children and their adoptive parents after 18 years of living together!!! • Not on test: Notice that, again, as noted in Table 2-4 on p. 72, there is a distinction between beneficial effects of adoption on the average IQ of adoptees while nevertheless, the adoptees remain more highly correlated with their biological parents. • Correlations are independent of the mean.
Behavior Genetics Methods: Adoption Studies • The findings of adoption studies are influenced by the range of the subject population. • Researchers try to study children adopted into a wide range of environments so that they will not underestimate the effects of environmental differences. • In general, a wider range, especially if it included abusive, highly stressful environments, would usually result in a lower estimate of genetic influences. Why?
Behavior Genetics Methods: Twin Studies • Monozygotic (MZ) (identical) twins: Twins that share the same sperm and egg. • Dizygotic (DZ) (fraternal) twins: Twins that have different sperm and egg. • Genetically they are no more alike than any other two siblings.
Behavior Genetics Methods: Twin Studies • Environmental influences are indicated if MZ twins and DZ twins have about the same correlations for a trait. • Genetic influences are indicated if MZ twins are substantially more similar than genetic twins. • Assumption: Environmental influences do not tend to make MZ twins more similar than DZ twins. • This would occur if parents treat MZ twins more similarly than DZ twins because, for example, it's cute to have them dress alike and if this procedure actually made their personalities or IQ more similar. • One way to get around this is to study MZ twins reared apart, especially if they are reared in radically different environments.
Behavior Genetics Methods: Twin Studies • Table 2.5 Correlations for IQ scores • MZ twins reared together .86 • MZ twins reared apart .79 • DZ twins reared together .60 • Siblings reared together: .47 • Parent and Child: .40 • Foster parent and child at age 7: .31 • at age 18:.00 • Siblings reared apart: .24 • Cousins: .15
THE DEGREE OF GENETIC INFLUENCE INCREASES AS CHILDREN APPROACH ADULTHOOD. Genetic Influences are stronger in adulthood than among children. • 1.) CORRELATIONS OF MZ TWINS STAY HIGH WHILE CORRELATIONS FOR DZ TWINS DECLINE • IQ CORRELATIONS FOR MZ AND DZ TWINS AGE MZ DZ 6 MO .75 .72 12 MO .68 .63 24 MO .81 .73 36 MO .88 .79 4 YR .83 .71 6 YR .86 .59 8 YR .83 .66 15 YR .88.54
THE DEGREE OF GENETIC INFLUENCE INCREASES AS CHILDREN APPROACH ADULTHOOD. Genetic Influences are stronger in adulthood than among children. • 2.) ADOPTION STUDIES a.) CORRELATION BETWEEN ADOPTIVE PARENTS AND ADOPTED CHILDREN DECLINES FROM .35 TO ZERO • AGE 7: r=0.35 AGE 17: r=0.00 • b.) IQ OF ADOPTED CHILDREN DECLINES TO CLOSE TO THE IQ OF NATURAL PARENTS • AGE 7: IQ OF ADOPTED CHILDREN = 110 • AGE 17: IQ OF ADOPTED CHILDREN = 95 • EXPLANATION: ACTIVE GENOTYPE → ENVIRONMENT INTERACTION (NICHE-PICKING) BECOMES MORE IMPORTANT AS CHILDREN GET OLDER.
Abusive Environments Lower IQ • CONCLUSION: DIFFERENT ENVIRONMENTS WITHIN THE "NORMAL" OR "AVERAGE" RANGE DO NOT HAVE MUCH INFLUENCE ON IQ. • HOWEVER, ABUSIVE ENVIRONMENTS CAN AND DO AFFECT IQ. AVERAGE VS ABUSIVE ENVIRONMENTS IQ score _____________________________________________ Abusive “Good enough” Average Enriched Quality of Environment Minor Gain from Better Normal Environments Abusive Environments Dramatically lower IQ
Is heritability higher at the low end of the socioeconomic status scale? • Text: A recent study by Turkheimer suggests less heritability (genetic influence) at the lower end of the socioeconomic scale, and much higher heritability at the higher ends. • The idea is that in better environments, the vast majority of variation is caused by genetic variation. • But in poor environments, more variation is caused by bad environments. • However, other studies have not found this effect except in clearly abusive environments.
Rank Order versus Average Effects of Adoption (not on test) • One classic adoption study showed that adopted children often averaged 20 or more IQ points higher than their biological mothers. • Because in this study the adoptive parents tended to be more highly educated and more socially and economically advantaged than the biological parents, this result was probably due to the more stimulating home environment that the adoptive parents provided. • But note also that, despite this environmental influence on development, individual differences seemed still to be substantially influenced by genetic inheritance. • The rank ordering of the children's IQ scores more closely resembled that of their biological mothers than that of their adoptive parents. • The children whose biological mothers had the lowest IQ scores were likely to have lower IQ scores than the children whose biological mothers scored higher. • Thus, although the absolute level of intellectual development was apparently boosted by the environmental influences provided by the adoptive parents, individual differences among the adopted children in intellectual performance—that is, their relative standings in this regard—appeared to stem more from their biological inheritance than from the increased intellectual stimulation provided in their adoptive homes.
Rank Order versus Average Effects of Adoption (not on test) CHILDREN ADOPTED NEAR BIRTH 120 111 115 129 125 Adoptive Parents: Average IQ= 120 114 112 110 108 106 Adopted Children: Average IQ = 110 94 92 90 88 86 Natural Parents: Average IQ = 90 On average, adopted children gain 20 IQ points, but individual differences are affected by natural parents’ IQ
Rank Order versus Average Effects of Adoption (not on test) • TESTED AT AGE 7: • ENVIRONMENTAL VARIATION IS IMPORTANT: • AVERAGE OF AC (110) > AVERAGE OF NP (90); • THIS IS AN AVERAGE EFFECT OF ADOPTION OF 20 IQ POINTS. • STUDIES TEND TO SHOW THAT THIS AVERAGE EFFECT WASHES OUT AS THE CHILDREN APPROACH ADULTHOOD. • GENETIC VARIATION IS IMPORTANT: 1.) AVERAGE OF AC (110) < AVERAGE OF AP (120) • 2.) POSITIVE CORRELATION BETWEEN AC AND NP
Interactions between Genes and Environments • Interactions between genes and environments modeled by Gottlieb's bi-directional model. • Note that the environmental effects on the genes refer to turning the genes on or off, not to actually modifying the genes. • In the mallard duck, a 'genetically governed preference' for the sounds of other ducks is modified by exposing them to different sounds before they are born. • The idea would be that a different gene would be turned on, not that the duck's genes are changed.
Interactions between Genes and Environments • Interactions between genes and environments modeled by Gottlieb's bi-directional model. • Tennis and testosterone: Loss affects • behavior (slumping posture) • psychological state (low self-esteem) • neural activity in certain parts of the brain; • the genes for testosterone are turned off. • But the genes haven't been changed by these events. • When the person later wins a match, the genes may turn on again.