Download
1 / 14
140 likes | 254 Views
Testing Bacterial Proteins for Evidence of Horizontal Gene Transfer. James Godde, John Iverson, Kabi Neupane, and Sara Penhale. Repetitive DNA. Found in abundance in Eukaryotes Only 1% of the human genome encodes protein, while more than half of the genome consists of repetitive DNA.

E N D
Testing Bacterial Proteins for Evidence of Horizontal Gene Transfer James Godde, John Iverson, Kabi Neupane, and Sara Penhale
Repetitive DNA • Found in abundance in Eukaryotes Only 1% of the human genome encodes protein, while more than half of the genome consists of repetitive DNA. • Relatively rare in Prokaryotes Nearly 89% of the E. coli genome encodes protein, while less than 1% consists of repetitive DNA
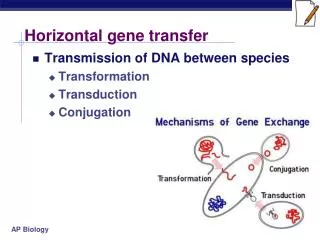
CRISPRs • What is a CRISPR? • Clustered Regularly Interspersed Short Palindromic Repeats • Class of repeats found exclusively in prokaryotes • How widespread are they? Frequency of Occurrence Unknown • What is their function? Function Unknown • How did they get there in the first place? Mode of Transmission Unknown
What are Cas genes? • In addition to the CRISPR sequences themselves, there are a number of genes usually found in close association with the regions of repetitive DNA • These genes were termed Cas (CRISPR associated) genes • There are 4 Cas genes which have been characterized to date. The function of each gene can be guessed at due to similarities they share with known genes: • Cas 1 is homologous to a DNA repair gene • Cas 2 is homologous to a transposase • Cas 3 is homologous to a helicase • Cas 4 is homologous to RecB exonuclease
Finding Cas genes • Cas genes were found by using NCBI BLAST to search for homologs to previously characterized Cas genes (Jansen et al., 2002), as well as to any newly characterized ones • In addition to homology with other genes, Cas genes had to be located near CRISPR sequences themselves
Cas 1 Cas 2 Cas 3 Cas 4
Formation of a total evidence tree • Cas genes have been found in 115 different species of prokaryotes • Analysis was limited to the 58 species for which sequence data were available for all four Cas genes • Protein sequences for all Cas genes were concatenated and aligned using Clustal W • Combined dataset was used to draw a neighbor-joining tree with MacVector
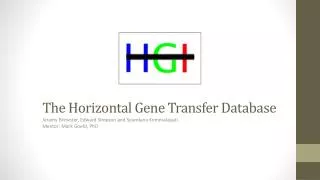
Classical rRNA-based Phylogeny Eukarya Archaea Bacteria Yang et al., 2005
Classical rRNA-based Phylogeny Bacteria Archaea Yang et al., 2005
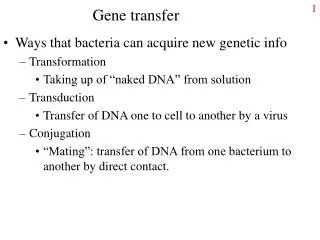
Method: Neighbor Joining; Best Tree; tie breaking = Random Distance: Absolute (# differences) Gaps distributed proportionally Nostoc pun 462.82 Nanoarchaem 400.18 Pyrococcus hor 1 503.823 Archaeoglobus 2 461.177 Methanobacterium 396.724 Thermotoga 443.276 Rubrobacter 420.201 Clostridium ther 444.953 Desulfobacterium 2 397.047 Thermoanaerobacter 466.496 Fusobacterium 491.409 Moorella 2 397.048 Porphyromonas 356.952 Bacteroides Methanosarcina bar 261.984 Methanosarcina acet 364.747 Methanococcus Pyrococcus hor 2 229.253 Pyrococcus fur 525.293 Chloroflexus 590.433 Corynebacterium 549.823 Chlorobium 2 407.176 Desulfovibrio desul 461.936 Rhodospillium 1 230.257 Salmonella typhi CT18 240.755 Salmonella typhimurium 233.245 E. coli K12 367.033 E. coli 0157 364.967 Geobacter sulf 344.971 Photobacterium (mega) 350.083 Sulfolobus tok 410.917 Sulfolobus sol 361.245 Archaeoglobus 1 511.755 Methanosarcina maz 310.026 Leptospira (lai) 443.945 Streptococcus pyo 1 Streptococcus aga 2603 384.555 Streptococcus aga NEM316 324.992 Streptococcus pyo 2 276.008 Streptococcus mut 356.965 Moorella 1 340.257 Geobacter meta 327.743 Methylococcus 410.048 Magnetococcus 300.729 Chlorobium 1 329.271 Desulfovibrio vul (mega) 370.48 Shewanella (Sargasso Sea) 328.255 Rhodospillium 2 243.306 Xanthomonas 215.778 Chromobacterium 228.222 Azotobacter 410.47 Bacillus halo 395.173 414.53 Desulfobacterium 1 431.986 Pyrobaculum aero 531.322 Thermus HB8 (mega) 492.327 Synechocystis (mega) Nostoc 7120 200.0 Archaea
Method: Neighbor Joining; Best Tree; tie breaking = Random Distance: Absolute (# differences) Gaps distributed proportionally Nostoc pun 462.82 Nanoarchaem 400.18 Pyrococcus hor 1 503.823 Archaeoglobus 2 461.177 Methanobacterium 396.724 Thermotoga 443.276 Rubrobacter 420.201 Clostridium ther 444.953 Desulfobacterium 2 397.047 Thermoanaerobacter 466.496 Fusobacterium 491.409 Moorella 2 397.048 Porphyromonas 356.952 Bacteroides Methanosarcina bar 261.984 Methanosarcina acet 364.747 Methanococcus Pyrococcus hor 2 229.253 Pyrococcus fur 525.293 Chloroflexus 590.433 Corynebacterium 549.823 Chlorobium 2 407.176 Desulfovibrio desul 461.936 Rhodospillium 1 230.257 Salmonella typhi CT18 240.755 Salmonella typhimurium 233.245 E. coli K12 367.033 E. coli 0157 364.967 Geobacter sulf 344.971 Photobacterium (mega) 350.083 Sulfolobus tok 410.917 Sulfolobus sol 361.245 Archaeoglobus 1 511.755 Methanosarcina maz 310.026 Leptospira (lai) 443.945 Streptococcus pyo 1 Streptococcus aga 2603 384.555 Streptococcus aga NEM316 324.992 Streptococcus pyo 2 276.008 Streptococcus mut 356.965 Moorella 1 340.257 Geobacter meta 327.743 Methylococcus 410.048 Magnetococcus 300.729 Chlorobium 1 329.271 Desulfovibrio vul (mega) 370.48 Shewanella (Sargasso Sea) 328.255 Rhodospillium 2 243.306 Xanthomonas 215.778 Chromobacterium 228.222 Azotobacter 410.47 Bacillus halo 395.173 414.53 Desulfobacterium 1 431.986 Pyrobaculum aero 531.322 Thermus HB8 (mega) 492.327 Synechocystis (mega) Nostoc 7120 200.0 Proteobacteria
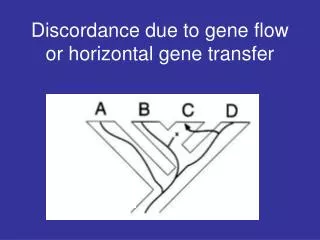
Conclusions • The total evidence tree is a good representation of the individual Cas gene trees, and can be used to draw the same conclusions • The trees support the hypothesis that Cas genes have been passed via horizontal gene transfer • More work is required to eliminate the alternate hypothesis that the trees reflect convergent evolution in response to similar environments
References • Yang, S. Doolittle, R. F., and Bourne, P. E. 2005. Phylogeny determined by protein domain content. PNAS 102:373-378. • Jansen, R., van Embden, J. D., Gaastra, W., and Schouls, L. M. 2002. Identification of genes that are associated with DNA repeats in prokaryotes. Mol. Microbiol. 43:1565-1575.