Download
1 / 17
170 likes | 323 Views
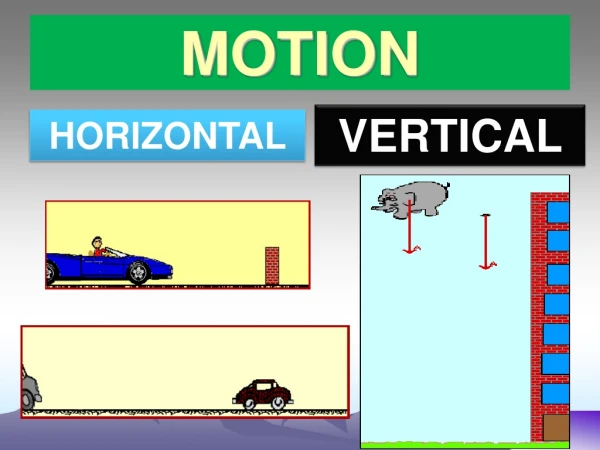
Motion. Energy Flow in Technological Systems Unit C. Motion . Motion of an object occurs when an imaginary line joining object to reference point changes in length, direction or both Analyze motion of object only if we compare objects position to another point (reference point)

E N D
Motion Energy Flow in Technological Systems Unit C
Motion • Motion of an object occurs when an imaginary line joining object to reference point changes in length, direction or both • Analyze motion of object only if we compare objects position to another point (reference point) • Once we know motion is present we can describe type & rate of motion
Simplest form of MotionUniform Motion • Object that travels at constant rate of motion in straight line moving in uniform motion • Use term Average speed to describe it • Average speed is uniform motion that involves traveling a distance in a specified time
Average Speed • Formula to determine an objects average speed Average speed = distance traveled time elapsed v (m/s) = d (m) = d final – d initial t (s) t final – t initial means change in
Example • You can now use this formula to determine the average speed of object A person walks 10.0m away from a stop sign in 5.00s. What is the average speed of the person?
Analyze average speed/uniform motion • Graphs provide visual representation of motion and shows relationship between two variables • 2 types of graphs to describe Uniform motion 1. Distance-Time Graphs What does it look like? • Plot distance vs time • Distance in meters on the y axis and Time in seconds on the x axis • Line will be straight with a positive slope What does it tell us? • Shows us direct relationship between distance traveled and time it takes • Straight line means uniform motion • Slope of the line tells you the average speed of the object • The steeper the slope the faster the speed
2. Speed-Time Graphs What does it look like? • Plot speed vs time • Speed in m/s on the y axis and Time in seconds on the x axis • Line will be level and straight What does it tell us? • Shows us whether the object was moving in uniform motion • If slope of the line is zero it tells you the average speed of the object was constant • Area under the line also helps us calculate the distance the object traveled
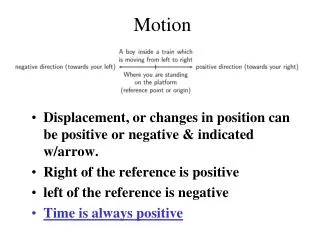
Vectors and Scalar Quantities • Scalars are quantities that describe the size or amount (magnitude) e.g. speed, distance, time • Vectors are quantities that describe direction as well as magnitude e.g. velocity, displacement, position • An arrow is placed above the number or symbol to indicate it as a vector
Distance vs. Displacement • Distance is scalar describing the length between 2 points or locations (d) • Displacement/Position is vector describing distance between 2 points AND the change in direction that took place (d [E]) • When writing displacement always include direction object was moving in square brackets
Velocity vs. Speed • Speed is scalar describing the distance an object travels during a given time (v) Remember v (m/s) = d (m) = d final – d initial t (s) t final – t initial • Velocity is vector describing the displacement of an object during a given time ( v [E] ) ( v [E](m/s) = d [E] (m) = d [E]final – d[E] initial t (s) t final – t initial
Analyze Velocity • Graphs provide visual representation of motion and shows relationship between two variables • Position -Time Graph • Plots position (displacement) on the y axis and time on the x axis • Shows us in position of an object in relation to the passing time • If line is straight we assume object is moving in uniform motion • Slope of the line is equal to the objects velocity
Most common form of motionNon Uniform motion • Occurs when there is a change in the speed of an object over the period of time • Object is moving at a inconsistent rate • Speeding up/accelerating • Slowing down/decelerating • Use the term acceleration to describe it • Acceleration is non uniform motion that involves speeding up or slowing down in a specified time
Acceleration • Formula to determine an objects acceleration/deceleration Acceleration= change in speed time elapsed a (m/s2) = v (m/s) = v final – v initial t (s) t final – t initial means change in if the answer is positive means speeding up if answer is negative means slowing down
Example A train starts from rest and reaches a velocity of 54 km/h in 10.0s. What is the acceleration? A golf ball rolling on a green slows down from 2.00 m/s to 1.50 m/s in 2.00 s. What is the rate of deceleration?
Analyze acceleration/non uniform motion • Graphs provide visual representation of motion and shows relationship between two variables • 2 types of graphs to describe non uniform motion 1. Position-Time Graphs What does it look like? • Plot position vs time • Position in meters (include direction) on the y axis and Time in seconds on the x axis • Line will be smooth and curved What does it tell us? • Shows us the direct relationship between position of object and time taken to travel • Shape of the curve of the line tells us whether the object was accelerating or decelerating • If slope gradually increasing the object is accelerating • If slope gradually decreasing the object is decelerating
2. Velocity-Time Graphs What does it look like? • Plot velocity vs. time to determine whether the object is accelerating or decelerating • Velocity (m/s) with direction on the y axis and time (seconds) on the x axis • The line of best fit is straight with either an increasing slope or a decreasing slope What does it tell us? • The slope of the line tells us whether the object was accelerating or decelerating • If slope is increasing then the object was accelerating • If the slope is decreasing then the object was decelerating • A straight horizontal line shows the object was uniform motion
Motion Quiz • Units, sig digs, scientific notation • Vector vsScalar quantities • Uniform motion vs Non uniform motion • Math • Speed • Velocity • Acceleration • Graphs • Speed-Time • Distance-Time • Velocity-Time • Position-Time