Download
1 / 26
260 likes | 266 Views
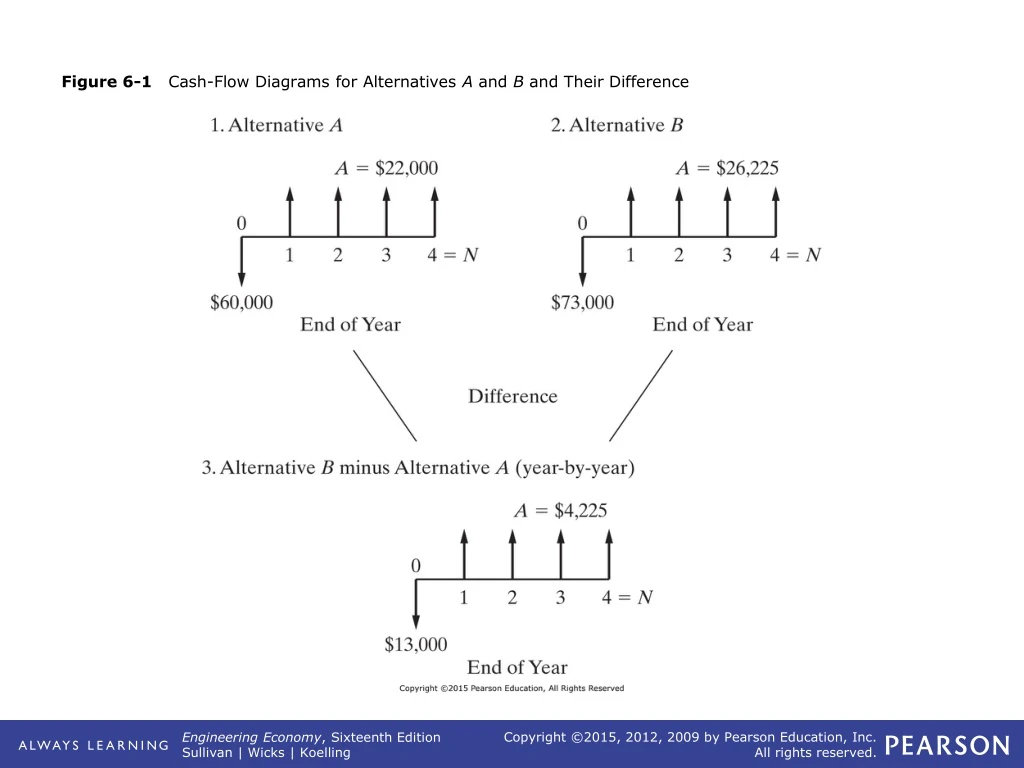
Figure 6-1 Cash-Flow Diagrams for Alternatives A and B and Their Difference. Figure 6-2 Cash-Flow Diagrams for Alternatives C and D and Their Difference. TABLE 6-1 Comparison of Four Molding Presses, Using the PW, AW, and FW Methods to Minimize Total Costs.

E N D
Figure 6-1 Cash-Flow Diagrams for Alternatives A and B and Their Difference
Figure 6-2 Cash-Flow Diagrams for Alternatives C and D and TheirDifference
TABLE 6-1 Comparison of Four Molding Presses, Using the PW, AW, and FW Methods to Minimize Total Costs
TABLE 6-2 Comparison of Four Molding Presses, Using the PW, AW, and FW Methods to Maximize Overall Profitability
Figure 6-5 Illustration of the Ranking Error in Studies Using the IRR Method
TABLE 6-3 Comparison of Five Acceptable Investment Alternatives Using the IRR Method (Example 6-4)
TABLE 6-4 Comparison of Four Cost (Design) Alternatives Using the IRR and PW Methods with Incremental Analysis (Example 6-5)
Figure 6-7 Representation of Capital Investment Increments and IRR on Increments Considered in Selecting Design 3 (D3) in Example 6-5
TABLE 6-5 Comparison of Three Mutually Exclusive Alternatives Using the ERR Method (Example 6-6)
Figure 6-9 Illustration of Repeatability Assumption (Example 6-7) and Coterminated Assumption (Example 6-8)
Figure 6-12 Cash-Flow Diagrams for the Pump Models Being Compared in Example 6-11
Figure 6-13 Individuals control chart for Savings Gap by Project ID. Four projects (7, 17, 34, and 35) had gaps that are beyond the control limits and are classified as out of control. Determining what is different about how these estimates were determined will likely lead to a way to improve the process.
Figure 6-14 Scatter plot of Savings Gap versus Product Type. The smaller variation of the Legacy product estimation process is clearly evident in this view of the data.
Figure 6-15 Scatter plot of Savings Gap versus Facility. The symbol outlines allow oneto visualize points with similar values. The West and East facilities have much greater variation in their savings estimates than the other locations.
Figure 6-16 Spreadsheet formulas for Individuals control chart. Only the first five projects from the database are shown to conserve space.
TABLE P6-6 Alternative Types of Cooling Towers for a 200-Megawatt Fossil-Fired Power Plant Operating at Full Capacitya in Problem 6-6