Download
1 / 20
200 likes | 326 Views
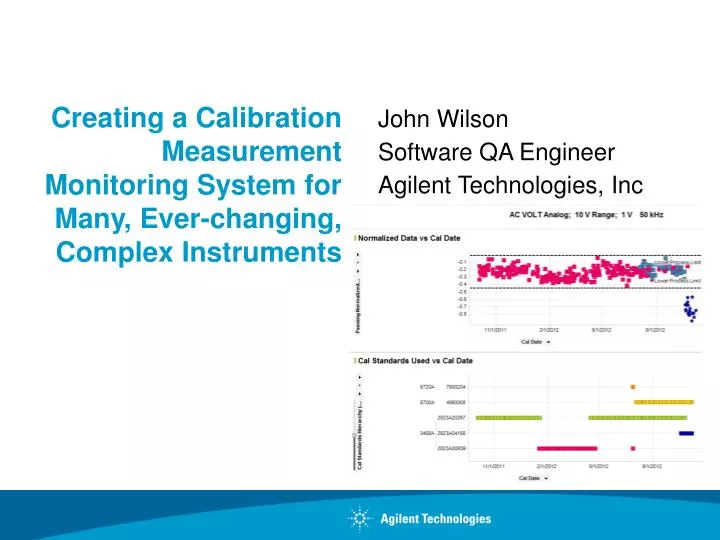
Creating a Calibration Measurement Monitoring System for Many, Ever-changing, Complex Instruments. John Wilson Software QA Engineer Agilent Technologies, Inc. Learning Objectives:.

E N D
Creating a Calibration Measurement Monitoring System for Many, Ever-changing, Complex Instruments John Wilson Software QA Engineer Agilent Technologies, Inc
Learning Objectives: • Learn design considerations for building a monitoring system for improving calibration quality for complex instruments. • Design goals • Enabling technologies/features • Learn monitoring systemsare needed, provide fasterdetection and resolution ofissues, and can beaccomplished with today’stechnology. (Case study)
Similar Situation – What is Our Situation? • Building a measurement monitoring system • ISO 17025 section 5.9 “Assuring the quality of test and calibration procedures” • ANSI/NCSL Z540.3 section 5.3.2 Measurement assurance procedures • Complex electronic instruments • Many instruments • Legacy instruments • Many new instruments added all the time • Many calibration platforms • Multiple sites • Geographically dispersed
Design Goals for a Calibration Measurement Monitoring System (CMMS) Monitor the parameters reported on the calibration reports received by customers Electronic data, not pdf or paper
Design Goals – Data Collection • Data collection/analysis should be frequent and ongoing • Like to be real time; but realistically we knew that was not achievable with our constraints in first effort. • Targeted daily updates. • Data collection should be unobtrusive • Collect data on what is already being done • Don’t add another test, don’t take away production time • Representative of work done for customers, not some idealized “best effort”
Design Goals – Analysis • Analysis should lead to corrective action • Not just detection, but provide trouble-shooting tools • Bring the relevant information to bear on the problem. • Analysis should communicate • Graphics: Language of engineering • Adequate engineering labeling • Dynamic labeling – Labels change on context, important with drill down • Fast decisions
Enabling Technology – Common Cal Format Test Stations: UUTs XML Schema - A common format for all calibration results CalServiceResultsXML File DMMs, Oscilloscopes Spectrum AnalyzersSignal Generators Timebase Visualization Output Phase Noise Other Relational Database
Enabling Technologies –Setting the Context Well Dynamic Titles Axis labels Reference lines Uncertainty bars Version coloring Date formats Communicating a message
Enabling Technologies – Summaries, Drill Down,In Memory Data Visualization and RAM • Enables FAST drill down from high level summaries to problem solution • With hundreds of thousands of points to analyze, need summaries to highlight trouble-spots. • Need to be able to drill down and isolate the core problem quickly • Two tools for dealing with query times for lower level data queries • In memory data visualization tools, combined with large RAM (4 - 8 Gbytes) • Tend to over-pull data on initial query • Caching (do the query overnight, cache results and examine in the morning) • Gives faster updates when exploring later • Data on demand
Enabling Technologies –Normalized Measurement Data for Charts 100 mV, 1 V, 10 V, 100 V, and 1000 V points all use same x-axis for histograms, normalized to -100 % (lower limit) at left to + 100 % (upper limit) at right. Upper and lower test limits vary from unit to unit, requiring normalization for control charts. Old trick - useful for bringing two different scales together. • Upper Spec Limit = +1 • Lower Spec Limit = -1
Enabling Features –Correlation: Bringing Relevant Information to Bear Bring in version, cal standards, location, time of day, temp, humidity, cal factor files dates Search for root cause and corrective action
Enabling Technologies –Standards and Measurement Uncertainties • Inclusion of point-by-point measurement uncertainties (MU) on measurement reports • Symbiotic relationship • Monitoring system enhanced by having MUs; • MU estimates improved by monitoring system • When process shifts by more than the MU allows, • either the process doesn’t conform to the process defined in the measurement uncertainty equation, or • the MU estimate has left out or underestimated a significant contributor. • Overall culture change • Monitoring implants MUs into the culture/process
Case Study – DMM MonitoringDiscovery, Trouble-shooting, Resolution Daily email summary: Tens of Service Centers 100s of calibrations 1000s of tests 100,000s of measurement points Boiled down to two issues:
Move from Normalized Data to Measured Data:Problem Exists in Calculation of Test Limits
Add Information to Basic Control Chart:Go From Problem Correlation Fast Solution
Does Anyone Else See the Same Problem?Compare to Other Service Centers Previously undetected occurrences Present Exception
Resolution: The characterization of the cal standard (which set the test limits) used a setting that was almost the same as the setting when the cal standard was used in measuring UUTs. Some cal standards were more sensitive to the settings than others. Code was changed so that the settings were exactly the same in the characterization of the cal standard and when used to measure UUTs.
Summary: Through a case study,you will have learnedhow we can improveour calibrationsby implementing process monitoring. My hope is you’ll walkaway having learneddesign considerationsto help implementyour process monitoring.