Download
1 / 3
30 likes | 216 Views
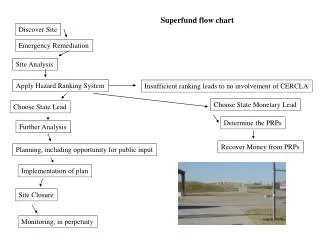
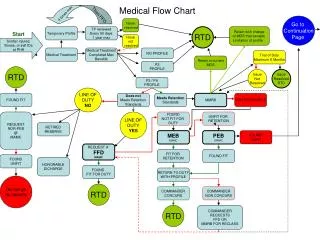
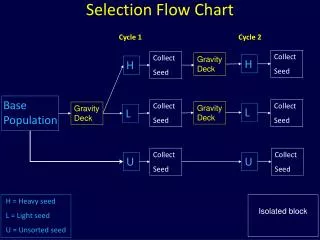
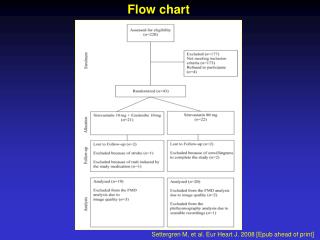
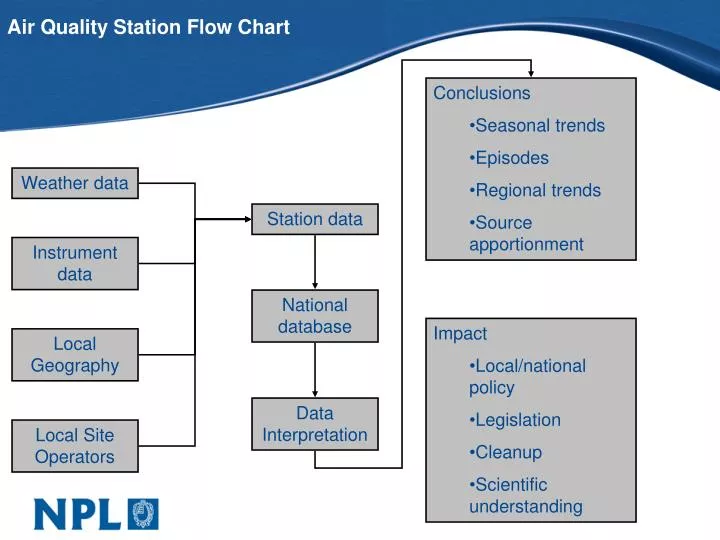
Weather data. Instrument data. Local Geography. Local Site Operators. Air Quality Station Flow Chart. Conclusions Seasonal trends Episodes Regional trends Source apportionment. Station data. National database. Impact Local/national policy Legislation Cleanup

E N D
Weather data Instrument data Local Geography Local Site Operators Air Quality Station Flow Chart • Conclusions • Seasonal trends • Episodes • Regional trends • Source apportionment Station data National database • Impact • Local/national policy • Legislation • Cleanup • Scientific understanding Data Interpretation
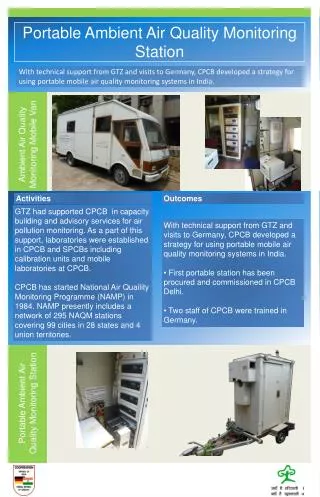
2nd Life Realisation of flow Chart • Need to achieve a high/low level split in detail. • Easy to design small expandable components that introduce different instruments etc. • Eg SMPS stand, weather stand, database stand… • The challenge lies in bringing the concepts together. • The key will be to show the flow of data from the field to (say) the news. • Initiate visit with bulletin screen with high impact headline or machinima
Mock up of exterior of a ‘typical’ AQ station Instrument stand Instrument stand Instrument stand 2nd Life realisation of flowchart Impact Interpretation Database Ground-based navigational prompts Intro screen