Download
1 / 1
20 likes | 206 Views
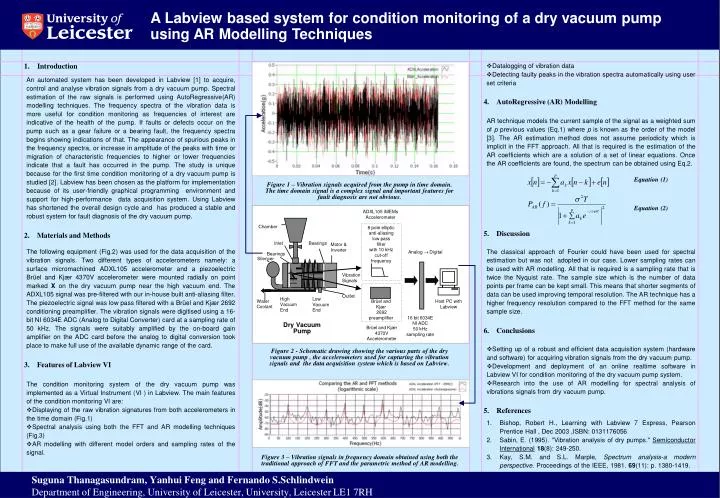
ADXL105 iMEMs Accelerometer. Chamber. 8 pole elliptic anti-aliasing low pass filter with 10 kHz cut-off frequency. Inlet. Bearings. Motor & Inverter. Analog Digital. Bearings. Silencer. x. X. Vibration Signals. Outlet. High Vacuum End. Low Vacuum End. Water Coolant.

E N D
ADXL105 iMEMs Accelerometer Chamber 8 pole elliptic anti-aliasing low pass filter with 10 kHz cut-off frequency Inlet Bearings Motor & Inverter Analog Digital Bearings Silencer x X Vibration Signals Outlet High Vacuum End Low Vacuum End Water Coolant Brüel and Kjær 2692 preamplifier Host PC with Labview 16 bit 6034E NI ADC 50 kHz sampling rate Dry Vacuum Pump Brüel and Kjær 4370V Accelerometer A Labview based system for condition monitoring of a dry vacuum pump using AR Modelling Techniques • Introduction • Datalogging of vibration data • Detecting faulty peaks in the vibration spectra automatically using user set criteria An automated system has been developed in Labview [1] to acquire, control and analyse vibration signals from a dry vacuum pump. Spectral estimation of the raw signals is performed using AutoRegressive(AR) modelling techniques. The frequency spectra of the vibration data is more useful for condition monitoring as frequencies of interest are indicative of the health of the pump. If faults or defects occur on the pump such as a gear failure or a bearing fault, the frequency spectra begins showing indications of that. The appearance of spurious peaks in the frequency spectra, or increase in amplitude of the peaks with time or migration of characteristic frequencies to higher or lower frequencies indicate that a fault has occurred in the pump. The study is unique because for the first time condition monitoring of a dry vacuum pump is studied [2]. Labview has been chosen as the platform for implementation because of its user-friendly graphical programming environment and support for high-performance data acquisition system. Using Labview has shortened the overall design cycle and has produced a stable and robust system for fault diagnosis of the dry vacuum pump. • AutoRegressive (AR) Modelling AR technique models the current sample of the signal as a weighted sum of p previous values (Eq.1) where p is known as the order of the model [3]. The AR estimation method does not assume periodicity which is implicit in the FFT approach. All that is required is the estimation of the AR coefficients which are a solution of a set of linear equations. Once the AR coefficients are found, the spectrum can be obtained using Eq.2. Equation (1) Figure 1 – Vibration signals acquired from the pump in time domain. The time domain signal is a complex signal and important features for fault diagnosis are not obvious. Equation (2) • Discussion • Materials and Methods The following equipment (Fig.2) was used for the data acquisition of the vibration signals. Two different types of accelerometers namely: a surface micromachined ADXL105 accelerometer and a piezoelectric Brüel and Kjær 4370V accelerometer were mounted radially on point marked X on the dry vacuum pump near the high vacuum end. The ADXL105 signal was pre-filtered with our in-house built anti-aliasing filter. The piezoelectric signal was low pass filtered with a Brüel and Kjær 2692 conditioning preamplifier. The vibration signals were digitised using a 16-bit NI 6034E ADC (Analog to Digital Converter) card at a sampling rate of 50 kHz. The signals were suitably amplified by the on-board gain amplifier on the ADC card before the analog to digital conversion took place to make full use of the available dynamic range of the card. The classical approach of Fourier could have been used for spectral estimation but was not adopted in our case. Lower sampling rates can be used with AR modelling. All that is required is a sampling rate that is twice the Nyquist rate. The sample size which is the number of data points per frame can be kept small. This means that shorter segments of data can be used improving temporal resolution. The AR technique has a higher frequency resolution compared to the FFT method for the same sample size. • Conclusions • Setting up of a robust and efficient data acquisition system (hardware and software) for acquiring vibration signals from the dry vacuum pump. • Development and deployment of an online realtime software in Labview VI for condition monitoring of the dry vacuum pump system. • Research into the use of AR modelling for spectral analysis of vibrations signals from dry vacuum pump. Figure 2 - Schematic drawing showing the various parts of the dry vacuum pump , the accelerometers used for capturing the vibration signals and the data acquisition system which is based on Labview. • Features of Labview VI • The condition monitoring system of the dry vacuum pump was implemented as a Virtual Instrument (VI ) in Labview. The main features of the condition monitoring VI are: • Displaying of the raw vibration signatures from both accelerometers in the time domain (Fig.1) • Spectral analysis using both the FFT and AR modelling techniques (Fig.3) • AR modelling with different model orders and sampling rates of the signal. • References • Bishop, Robert H., Learning with Labview 7 Express, Pearson Prentice Hall , Dec 2003 ,ISBN: 0131176056 • Sabin, E. (1995). "Vibration analysis of dry pumps." Semiconductor International18(8): 249-250. • Kay, S.M. and S.L. Marple, Spectrum analysis-a modern perspective. Proceedings of the IEEE, 1981. 69(11): p. 1380-1419. Figure 3 – Vibration signals in frequency domain obtained using both the traditional approach of FFT and the parametric method of AR modelling. Suguna Thanagasundram, Yanhui Feng and Fernando S.Schlindwein Department of Engineering, University of Leicester, University, Leicester LE1 7RH