Download
1 / 73
760 likes | 774 Views
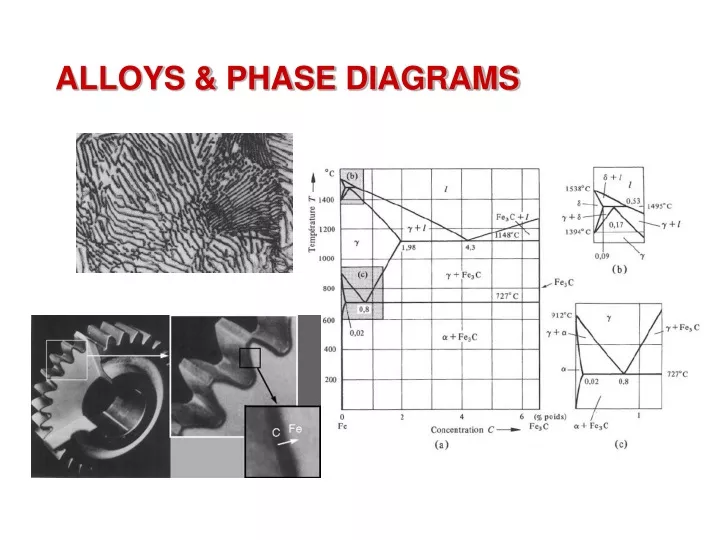
ALLOYS & PHASE DIAGRAMS. Jean P. Mercier, Gérald Zambelli, Wilfried Kurz, Introduction à la Science des Matériaux, Presses Polytechniques et Universitaires Romandes, ISBN 2-88074-402-4

E N D
Jean P. Mercier, Gérald Zambelli, Wilfried Kurz, Introduction à la Science des Matériaux, Presses Polytechniques et Universitaires Romandes, ISBN 2-88074-402-4 Jean P. Mercier, Gerald Zambelli, Wilfried Kurz, Introduction to Materials Science, Elsevier, ISBN 2-84299-286-5 Pure materials often have properties of technologically marginal interest. Most materials are mixtures of atoms or molecules of different nature. In some cases, the constituents (atoms or molecules) of the material are soluble in any proportion and the mixtures are homogeneous. In other cases, the components are only partially miscible. The material then contains multiple phases of different composition and structure. The combination of these different phases produced microstructures that dramatically influence the properties and specifications of materials. Phase diagrams are the basis for analyzing the formation of microstructures. They define in a simple manner the equilibrium states between phases.
A B Full miscibility Solid B Solid solution (over the whole compositional range) Solid A
A B Limited miscibility Solid solution (A in B) Solid B Two phases (Miscibility Gap) (Solvus) Solid A Solid solution B in A
A B Limited miscibility Intermediate compound Solid solution (A in B) Solid B Solid A Intermediate compound Solid solution B in A
Alloy Conventionally, an alloy is a material with metallic character combined with one or more metallic elements and/or possibly elements with non-metallic character. This concept, which is currently evolving, is gradually extended to other materials (ceramics, polymers).We now defines an alloyas a combination of atoms, ions or molecules to form a material whose properties differ from those of components.An alloy is usually composed of several phasesof microscopic size having different compositions and structures that contribute synergistically to the material properties.
An alloyis generally composed of two or more components and includes one or more phases. A phaseis a part of the system wherein the composition (type and concentration of the components present) and the atomic organization (crystalline or amorphous structure ...) are fixed. In a system at (thermodynamic) equilibrium, each phase has a fixed composition which is homogeneous in its full extent. (In non-equilibrium systems, very frequently encountered in materials, the composition may vary depending on time and location inside the material.) Each phase is separated from other phases of the system by an interface. For instance: the amorphous and crystalline phases are distinguished by their different atomicarrangements. Similarly, the component iron may exist in the vapor state, liquid state, cubic face-centered crystalline solid state or cubic centered crystal representing four different phases.
Examples A well known example of a metal alloy having two phases is that of steelsor carbon steels. Pure Cuhas a very high electrical conductivity, but its mechanical strength is not sufficient when the mechanical stresses are high. In order to harden it, another component is added, for example Sn or Zn. By adding a certain amount of Sn to Cu, a bronzeis obtained which is an alloy consisting of two phases: Cu + CuxSny. By adding a certain amount of Zn to Cu, brassis obtained which is an alloy consisting of two phases: Cu + CuxZny. A "hard metal"alloy used for cutting tool normally contains three components, Co, W and C, forming two phases: tungsten carbide (WC), in the form of grains, and a metallic Co, which is the ductile matrix linking hard and fragile tungsten carbide grains. Rubyused for the construction of lasers is a single crystalline alloy of Al2O3 (sapphire) and 0.05 percent Cr2O3. The characteristic red color of this crystal is due to the presence of Cr3+ ions dispersed in the sapphire crystal as a solid solution. In this case, the alloy has only one phase although it has two components.
Interfaces between phasesA phase occupies a determined volume in space limited by an interfacethat separates it from another phase. The grain boundaries are a particular type of interface as they mark the boundary between two crystal grains of the same composition and the same structure, but with different orientation.In general, the creation of an interface is a process that requires some work and which is therefore not energetically advantageous from the point of view of thermodynamics.The presence of interfaces therefore increases the free energy of a material. In general, fine grained systems, which are characterized by the presence of many interfaces, have a higher free energy than coarse systems.From the thermodynamic point of view, an interface is characterized by the specific interfacial energy 𝛾 [Jm-2],which, under certain conditions, can be equated to a surface tension [Nm-1]. The interfacial energy is independent of the interface area. It can be determined by measuring the work required to create a unitary interface.
ONE COMPONENT SYSTEMS Phase diagram of a pure crystallizable substance Generally, the temperature of the melting point increases very moderately with pressure. There are few substances such as water, Bi and Ga, which exhibit an increase in volume during crystallization. In this case, there is a lowering of the melting point temperature when the pressure is raised. Phase diagram at equilibrium for a pure substance describing the areas of stability of the crystalline solid, liquid and vapor. T = triple point, C = critical point, Tm (P1) = melting temperature at pressure P1 and Tv (P1) = vaporization temperature at pressure P1.
Gibbs Phase Rule Gibbs phase rule determines the number of phases p present in a system at equilibrium: p + f = n + 2 where n represents the number of components in the system and f the number of degrees of freedom of the system, i.e. the number of independent intensive variables. If we consider a system at equilibrium, there is a total of n + 1 variables to be determined (n - 1 mole fractions, T and P). A number of these variables can be set arbitrarily without changing the physical state of the system. This is called the number of degrees of freedom or the variance f of the system. In systems where pressure is fixed, the variance is automatically reduced by one: f + p = n + l (P = const) .
Phase diagram of a one component pure crystallizable substance Phase diagram at equilibrium for a pure substance describing the areas of stability of the crystalline solid, liquid and vapor. T = triple point, C = critical point, Tm (P1) = melting temperature at pressure P1 and Tv (P1) = vaporization temperature at pressure P1.
Let us apply the phase rule to the phase diagram of a pure substance For a pure substance, n = 1. The sum of the variance fand of the number of phases p is calculated and is always equal to three. In other words, the variance of a system consisting of a pure substance and having three phases in equilibrium, is equal to zero. Therefore in the equilibrium phase diagram, there is only one point (the triple point T' characterized by a single value of P and T) for which there is simultaneously the presence of three phasesat equilibrium. The (one dimensional) curves O'T'B and T'C determine the temperatures and pressures at which two phases can coexist. In this case, the variance f is unitary, that is to say that for the points of the system located on one of these three curves, one can choose freely either the temperature or the pressure (the second variable being determined by the first choice). The areas between the curves (OT'-T'B, T'B-T'C for example) are regions of the phase diagram where there is - at equilibrium - only the presence of one phase.
The free energy G of a phase is connected to its enthalpy H and its entropy S by the well known thermodynamic relationship (Smith, 1990): G = H - TS As the entropy S is higher for less ordered phases, their free enthalpy G decreases more rapidly with temperature than that of the more ordered phases. The most stable phase always has the smallest free enthalpy. Variation - at constant pressure - of the free enthalpy of the three stable phases of a pure substance as a function of temperature. Point A corresponds to the melting point Tm, B to the boiling point or vaporization point Tv, and C to a hypothetical transition between solid and vapor. The upper part of the curves not in bold correspond to thermodynamic states out-of-equilibrium.
A B Solid solution (A in B) Solid solution (A in B) Solid B Solid B Two phases (Miscibility Gap) Solid A Solid A (Solvus) Intermediate compound Solid solution B in A Solid solution B in A BINARY SYSTEMS PHASES EQUILIBRIUM IN BINARY SYSTEMS Let us examine the conditions for which a mixture of two components in equilibrium form a solution(solid or liquid), or exists as two distinct (liquid or solid) phases.
Binary systems Mixture of 2 phases A & B T, P = cste T, P = cste Mixture of 2 phases A & B over the whole range of composition ? Gm Gm ∆Gm Molar free entalphy G Molar free entalphy G T, P = cste Solid solution AB over the whole range of composition 0 1 0 1 Molar fraction XB Molar fraction XB B A B A ∆Gm Molar free entalphy G Gm 0 1 Variation of the free enthalpy of mixing Gm for a phase a consisting in two elements A and B, at constant T and P, in function of the molar fraction of element B. Molar fraction XB B A
Two phases: solid & liquid Binary systems One phase Variation of the free enthalpy of mixing Gm for a phase a consisting in two elements A and B, at constant T and P, in function of the molar fraction of element B. Variation of the free enthalpy G of a binary system at constant T and P: (a) enthalpy of mixing of a binary system A,B with a solid phase a and a liquid phase l. Gmand Gml are the free enthalpy of the phase and l, respectively. The 2 curves cross at G0, corresponding to the concentration X0, (b) Part of the diagram corresponding to a heterogeneous mixture (of two alloys of composition Xeand Xel.
What happens when the temperature changes? Binary systems The relative quantity of the two phases is determined by the lever rule: f and fl are the proportion of the and l phase, respectively. Since f + fl = 1, it is easy to demonstrate that: Binary system with two fully miscible components A and B. (a) to (f) Variation of the free enthalpy of mixing at various temperatures; (g) Phase diagram at equilibrium
Binary systems The relative quantity of the two phases is determined by the lever rule: f and fl are the proportion of the and l phase, respectively. Since f + fl = 1, it is easy to demonstrate that: Binary system with two fully miscible components A and B. (a) to (f) Variation of the free enthalpy of mixing at various temperatures; (g) Phase diagram at equilibrium
Binary systems The relative quantity of the two phases is determined by the lever rule: f and fl are the proportion of the and l phase, respectively. Since f + fl = 1, it is easy to demonstrate that: Binary system with two fully miscible components A and B. (a) to (f) Variation of the free enthalpy of mixing at various temperatures; (g) Phase diagram at equilibrium
Binary systems The relative quantity of the two phases is determined by the lever rule: f and fl are the proportion of the and l phase, respectively. Since f + fl = 1, it is easy to demonstrate that: Binary system with two fully miscible components A and B. (a) to (f) Variation of the free enthalpy of mixing at various temperatures; (g) Phase diagram at equilibrium
Binary systems The relative quantity of the two phases is determined by the lever rule: f and fl are the proportion of the and l phase, respectively. Since f + fl = 1, it is easy to demonstrate that: Binary system with two fully miscible components A and B. (a) to (f) Variation of the free enthalpy of mixing at various temperatures; (g) Phase diagram at equilibrium
Binary systems The relative quantity of the two phases is determined by the lever rule: f and fl are the proportion of the and l phase, respectively. Since f + fl = 1, it is easy to demonstrate that: Binary system with two fully miscible components A and B. (a) to (f) Variation of the free enthalpy of mixing at various temperatures; (g) Phase diagram at equilibrium
Binary systems The relative quantity of the two phases is determined by the lever rule: f and fl are the proportion of the and l phase, respectively. Since f + fl = 1, it is easy to demonstrate that: Binary system with two fully miscible components A and B. (a) to (f) Variation of the free enthalpy of mixing at various temperatures; (g) Phase diagram at equilibrium
Binary systems The relative quantity of the two phases is determined by the lever rule: f and fl are the proportion of the and l phase, respectively. Since f + fl = 1, it is easy to demonstrate that: Binary system with two fully miscible components A and B. (a) to (f) Variation of the free enthalpy of mixing at various temperatures; (g) Phase diagram at equilibrium
Alloys - Miscibility Gap Binary systems When a system consist in 2 components, it can form either a solid solution in the region of miscibility, or split into 2 phases (phase mixture)in the miscibility gap. • Variation of the free enthalpy of a systems of 2 components A and B exhibiting a miscibility gap at various temperatures • Equilibrium phase diagram Experimental construction of a phase diagram
Alloys - Miscibility Gap Binary systems When a system consist in 2 components, it can form either a solid solution in the region of miscibility, or split into 2 phases (phase mixture)in the miscibility gap. • Variation of the free enthalpy of a systems of 2 components A and B exhibiting a miscibility gap at various temperatures • Equilibrium phase diagram Experimental construction of a phase diagram
Solid Solutions & Phase Mixture A solid solution is a single phase which exists over a range in chemical compositions. Almost all minerals are able to tolerate variations in their chemistry (some more than others). Chemical variation greatly affects the stability and the behaviour of the mineral. Therefore it is crucial to understand: the factors controlling the extent of solid solution tolerated by a mineral the variation in enthalpy and entropy as a function of chemical composition different types of phase transition that can occur in solid solutions
Example: Olivines The two most important forms of olivine are: Forsterite Mg2SiO4 Fayalite Fe2SiO4 and Both forms have identical structures and identical symmetry. They differ only in the type of cation occupying the M sites. Most natural olivines contain a mixture of Mg and Fe on the M sites: (Mg, Fe)2SiO4. This is an example of substitutional solid solution. The composition of the solid solution is specified in terms of the mole fraction of the two endmembers forsterite and fayalite. e.g. (Mg0.4Fe2+0.6)2SiO4 is said to contain 40% forsterite and 60% fayalite (often abbreviated to Fo40Fa60)
Substitutional solid solutions Specific sites in the structure (e.g. M-sites in olivine) are occupied by either Mg or Fe. In the ideal case, Mg and Fe are randomly distributed. The probability of any one site being Mg is equal to the mole fraction of Mg in the system. e.g. in Fo40Fa60, each site has a 40% chance of being occupied by Mg and a 60% change of being occupied by Fe.
Other types of solid solution Coupled substitution : Cations of different charge are substituted for each other. Requires two coupled substitutions to maintain charge balance. e.g. Al3+ + Ca2+ = Si4+ + Na+ in plagioclase feldspars. [NaAlSi3O8 Albite (Ab) & CaAl2Si2O8 Anorthite (An)] Omission solid solution : Chemical variation achieved by omitting cations from sites that are normally occupied. e.g. pyrhottite solid solution between FeS and Fe7S8. Charge balance is achieved by changing the valance of transition metal cations (e.g. Fe2+ is converted to Fe3+) Interstitial solid solution : Cations are inserted into sites not normally occupied in the structure. e.g. solid solution between tridymite (SiO2) and nephaline (NaAlSiO4) achieved by stuffing Na into channel sites and substituting Al for Si in framework.
Ca 1.14 Å Mg 0.86 Å Fe2+ 0.92 Å 32% 7% Factors controlling the extent of solid solution Cation Size If cation sizes are very similar (i.e. ionic radii differ by less than 15%) then extensive or complete solid solution is often observed.
Factors controlling the extent of solid solution Crystal Structure & Structural flexibility Complete miscibility implies the same crystal structure Cation size alone is not enough to determine the extent of solid solution, it also depends on the ability of the structural framework to flex and accommodate differently-sized cations e.g. there is extensive solid solution between MgCO3 and CaCO3 at high temperature Cation charge (Valence) Complete solid solution is usually only possible if the substituting cations differ by a maximum of ± 1. Heterovalent (coupled) substitutions often lead to complex behaviour at low temperatures due to the need to maintain local charge balance. [Règles de Hume-Rothery (empiriques)]
Factors controlling the extent of solid solution Crystal Structure & Structural flexibility • Règles de Hume- Rothery (empiriques) • Same size of the cations (atoms) • Same (crystal) structure • Same charge or valence • (max. differencetolerated -+ 1 when charge balance canbepreserved) Complete miscibility implies the same crystal structure Cation size alone is not enough to determine the extent of solid solution, it also depends on the ability of the structural framework to flex and accommodate differently-sized cations e.g. there is extensive solid solution between MgCO3 and CaCO3 at high temperature Cation charge (Valence) Complete solid solution is usually only possible if the substituting cations differ by a maximum of ± 1. Heterovalent (coupled) substitutions often lead to complex behaviour at low temperatures due to the need to maintain local charge balance.
Thermodynamics of solid solutions (Phase mixture) Exsolution Cation ordering
Factors controlling the extent of solid solution Temperature Extent of solid solution tolerated is greater at higher temperatures G = H – TS Cation-size mismatch increases the enthalpy (structure must strain to accommodate cations of different size): solid solution is destabilised at low temperatures Cation disorder in a solid solution increases the configurational entropy: solid solution is stabilised at high temperature
Thermodynamics of solid solutions Enthalpy H = ½ N z (xA2 WAA + xB2 WBB + 2 xA xBWAB) N = number of sites, z = coordination xA,B = molar fraction of A,B H = H(mechanical mixture)+ DH(mixing) = ½ N z (xAWAA + xBWBB) + ½ N z xA xB(2WAB - WAA - WBB ) J = (2WAB - WAA - WBB ) If J > 0 then like neighbours (AA and BB) are favoured over unlike neighbours (AB) If J < 0 then unlike neighbours (AB) are favoured over like neighbours (AA and BB)
Thermodynamics of solid solutions Enthalpy H = ½ N z (xA2 WAA + xB2 WBB + 2 xA xBWAB) ½ N z (xAWAA + xBWBB) + ½ N z xAxB (2WAB - WAA - WBB ) = ½ N z (xAWAA + xBWBB)[(xA+xB)=1]+ ½ N z xAxB (2WAB - WAA - WBB ) N = number of sites, z = coordination xA,B = molar fraction of A,B H = H(mechanical mixture)+ DH(mixing) = ½ N z (xAWAA + xBWBB) + ½ N z xA xB(2WAB - WAA - WBB ) J = (2WAB - WAA - WBB ) If J > 0 then like neighbours (AA and BB) are favoured over unlike neighbours (AB) If J < 0 then unlike neighbours (AB) are favoured over like neighbours (AA and BB)
Thermodynamics of solid solutions Enthalpy Hmix = 1/2 NzxAxB [2WAB - WAA - WBB] = 1/2 NzxAxB J If J > 0 then like neighbours (AA and BB) are favoured over unlike neighbours (AB) If J < 0 then unlike neighbours (AB) are favoured over like neighbours (AA and BB)
Thermodynamics of solid solutions Entropy DSmix = k ln w w = no. of degenerate configurations of the system For a collection of N atoms, consisting of NA A atoms and NB B atoms, the no. of configurations is: Simplifies to: DSmix = - R (xA ln xA + xB ln xB) per mole of sites. Stirling formula: lnN! = NlnN-N (when N very large)
Free energy of mixing Hmix = 1/2 NzxAxBW Smix = - R (xA ln xA + xB ln xB) Gmix = Hmix - TSmix
Ideal solid solution (DHmix = 0) In an ideal solid solution, the two cations substituting for each other are very similar (same charge and similar size). Gmix = - TSmix Solid solution is stable at all compositions and all temperatures. Example: The forsterite-fayalite solid solution is very close to ideal!
Non-ideal solid solution (DHmix < 0) Obviously we have a solid solution over the whole composition range. However, here the change in free energy relative to the ideal case is more subtle There is a strong driving force for cation ordering in the centre of the solid solution, where the ratio of A:B cations is 1:1. The fully-ordered phase has zero configurational entropy, because there is just one way to arrange the atoms (two if you include the equivalent anti-ordered state). However, it has a low enthalpy due to the energetically-favourable arrangement of cations. This stabilises the ordered phase at low temperature, where the –TΔSmix term in the free energy is less important. The fully disordered solid solution has a high configurational entropy, which stabilises it at high temperature.
Non-ideal solid solution (DHmix < 0) The ordered phase is stabilized at low temperature, where the –TΔSmix term in the free energy is less important. The fully disordered solid solution has a high configurational entropy, which stabilises it at high temperature. There is a phase transition from the ordered phase to the disordered phase at a critical transition temperature (Tc). The phase diagram for a 2nd-order cation ordering phase transition simply shows a transition from a single-phase disordered solid solution to a single-phase ordered solid solution at each composition, with the transition temperature varying parabolically as a function of composition. Cation ordering phase transition occurs below a particular transition temperature Tc Tc varies with composition - highest in the centre when A:B ratio is 1:1
Non-ideal solid solution (DHmix > 0) Free energy develops minima at low temperature due to competition between positive DHmix term and negative -TDSmix term. Solid solution is unstable at intermediate compositions. Equilibrium behaviour is given by the common tangent construction.
Non-ideal solid solution (DHmix > 0) Phase mixture: Phase with bulk composition C0splitsinto two phases Q and R with compositions C1 and C2. Lever Rule: Proportion of Q = (C2-C0)/(C2-C1) = b / (a+b) Proportion of R = (C0-C1)/(C2-C1) = a / (a+b) a b C0
Equilibrium vs. fractional crystallisation Equilibrium crystallisation When cooling is very slow the liquid and melt remain in equilibrium with each other. The compositions of the phases are able to continuously adjust to the new temperature. Final result is a homogeneoussolid with the same composition as original melt (if cooling too quick get zoning). Fractional crystallisation Crystals are removed from contact with the melt as soon as they form. Since crystals forming are enriched in one element, the residual melt becomes progressively enriched in the other element. The bulk composition of the system evolves with time.