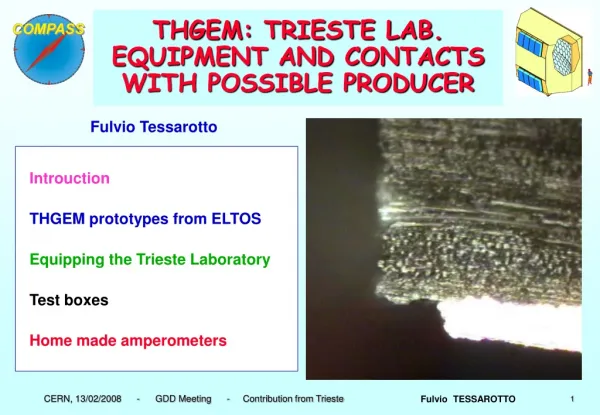
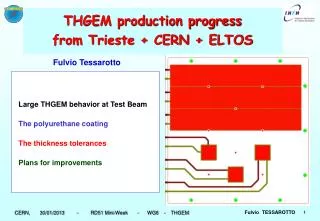
Download
1 / 15
150 likes | 253 Views
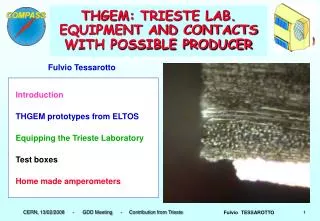
First observations on CsI -coated ThGEM in Trieste - ADDENDUM -. presented by Gabriele Giacomini phone meeting 20/08/2008.

E N D
First observations on CsI-coated ThGEM in Trieste- ADDENDUM - presented by Gabriele Giacomini phone meeting 20/08/2008
In these preliminary measurements we used a deuterium lamp (AVALIGHT-DHS produced by AVANTES) to extract electrons from a CsI layer, coating the “top” surface of the ThGEM (type “C4”). This irradiation produces a DC current, which is measured by picoammeters ( Keithley and home-made) . The amount of irradiation is not accurately known (since the lamp is not perfectly calibrated), then information about the gain cannot be extracted from these measurements. Irradiation level is chosen to avoid a fast ageing of the CsI layer, known to lose its quantum efficiency after a collected charge of ~ mC/cm2.
ThGEM characteristics: CsI quantum efficiency • ThGEM type C4: • Size = 3 X 3 cm2 • Rim = 100 mm • Pitch = 0.8 mm • thickness = 0.4 mm • Top coated by CsI acting as photocathode(over 5 mm of Ni and 0.02 mm of Au) • ( good quantum efficiency for l < 200 nm) CsI is damaged by moisture exposure, then the right procedure is to always keep the CsI layer under vacuum or clean atmosphere (~ < 20 ppm H20 and O2). In our case, only after CsI deposition (at CERN) the ThGEM has been put under a vacuum container, then suffering a short exposure. During the mounting operations, the unavoidable air exposure has been minimized by flushing N2 over the CsI, besides keeping the whole duration as short as possible (< 10’). The CsI layer survived showing, as test # zero, sensitivity to environment solar UV and blindness to halogen lamp. l (nm) (From L. Molnar – RICH 2007 Trieste)
The chamber PicoAmmeter KEITHLEY HV in High quality quartz window (HERAUS Suprasil II) Ar/CO2 (70/30) In (N2 while idle) Ar/CO2 out (N2 while idle) THGEM top, coated with CsI Cathode wires (almost invisible)
The set-up AVALIGHT-DHS Deuterium lamp Optic fiber and its holder. The beam out of the fiber diverges and irradiates the whole quartz window. The anode pads are covered by an Aluminum box, a BNC carries out the signal/current
Just a sketch … Beam out from optic fiber Quartz window hn Cathode wires - HV 10 MW e- 7 mm Top: CsI coated - HV 10 MW 0.4 mm Bottom - HV 10 MW 5 mm Anode pads gas in gas out 1 MW signal/current
Measurement of the photocurrent (no gain on THGEM) collection efficiency • Photoelectrons collected by cathode (grounded by Keithley picoammeter) and • DV = -100 V, so electrons drift only towards cathode wires. • anode GND • Scan in Vtop (then in E drift), • keeping fixed DV • 1000 V ~ 1kV/cm Ar/CO2 1 atm • The collection efficiency is a monotonic function of the “Drift” Electric Field • There are several effects: • e- extraction efficiency from CsI depends on drift/diffusion inside CsI itself • Potential barrier between CsI and “vacuum” depends on the Fields • higher fields decrease the detrimental effect of electron backscattering on gas atoms/ molecules, accounting for a charge loosing • Some gain at the cathode wires?
Very rough estimation of the # of photons A current of 10 pA ~108 e-/s, supposing 1/10th is extracted 109/s e- produced The q.e. of CsI is very small at these wavelength (> 200 nm) - and it is wavelength dependent. So, let’s say we have 1012/s photons impinging the CsI layer… An independent way to estimate the number of photons: With a spectrophotometer (AVAspec - AVANTES) we acquire the irradiance spectra of the Halogen and deuterium lamps. The light of the halogen photogenerates a DC current in a photodiode: knowing the light absorption in silicon, we are able to state – in first approximation - the number of photons emitted by the halogen lamp. Comparing the spectra, we should know the photons emitted by the deuterium lamp (1.5e13 for l<300nm). We don’t like the shoulder on the left of the Deuterium spectrum: maybe it’s an artifact of the spectrophotometer making this measurement useless and wrong… ?
DV scan (gain from ThGEM) • In this set-up: • Electrons collected by anode • Edrift (fixed) = 0 V/cm • (but we measured Ianode to be insensitive • to E drift ) • Einduction (fixed) = 4000 V/cm • Scan in DV, until multiplication occurs The currents reported are read immediately after the opening of the shutter, the currents then decrease with time, due to the well known polarization effects. • The graph shows three regions: • DV < 250 : partial collection of electrons inside the holes • 250 V < DV < 1000 V : enhanced collection inside holes but gain still ~ 1 • DV > 1000 V : multiplication (we gain a factor 2 every 80 V) In the last points the currents are huge (and time dependent) so we don’t stay for long times. - In this range, environment light too provides high current
Wavelength response To study the response of CsI to a specific wavelength, we filtered the D2 light source with several narrow bandpass filters (450, 390, 340, 289, 239 nm). We measure again the anode current and we operate the THGEM while it multiplies: DV > 1000V The beam spot irradiates the filter, while the environment light is blocked by the black paper sheet, covering the quartz window. The chamber is blind at 450, 390 and 340 nm (as expected from CsI) but shows significant sensitivity at 289 and, more, at 239 nm.
Induction scans for different DV (i.e. gains) • Keeping fix the DV (the gain), • we are interested to the ratio : • Ianode / Ianode+bottom • e.g., to decide the voltages in order to get: • a good signal from the anode • a trigger from the bottom. • This ratio is a monotonicfunction of the induction field and saturates at quite high induction fields. DV = 1400 V DV = 1550 V DV = 1480 V Increasing the gain, for a given induction field, more and more electrons go to bottom: the fringe of the hole field competes with the induction field in the electron collection, lowering the ratio of the electrons reaching the anode.
DV scan - II With the 240 nm filter, we do again the DV scan – for two different Vinduction – reading the currents from anode, bottom, top and drift. (Einduction=6kV/cm) (Einduction=4kV/cm) Vdrift = 3000 V Vdrift = 4000 V Idrift is ~ 0, altough Edrift has a sign for which the cathode competes with the holes in collecting the electrons (Vdrift is constant). Increasing the gain, more electrons to BOTTOM
Time development of the currents DV scan (Vcathode = 3 kV & Einduction = 4 kV/cm) DV = 1500 V DV = 1550 V DV = 1600 V DV = 1650 V For DV < 1600 V, the currents decrease after their initial value (nothing new) but for DV > ~ 1600 V the currents increase. ???A positive feedback due to some kind of bombardment of the CsI layer???
Time development of the currents DV scan (Vcathode = 3 kV & Einduction = 4 kV/cm) Vcathode = 3kV & Einduction = 4 kV/cm DV = 1600 V DV = 1650 V DV = 1700 V It’s a huge effect
Time development of the currents DV scan - II (Vcathode = 4 kV & Einduction = 6 kV/cm) DV = 1650 V DV = 1550 V DV = 1600 V Voltage change The currents increase again at DV = 1600 V, so it’s the DV and not Einduction or Edrift responsible for this effect