Download
1 / 12
120 likes | 254 Views
Deuteron polarimetry from 1.0 to 1.5 GeV/c. Ed Stephenson, IUCF EDM discussion April 14, 2006. Based on work from:. France: POMME B. Bonin et al. Nucl. Inst. Methods A288 ,389 (1990) V.P. Ladygin et al., Nucl. Inst. Methods A404 , 129 (1998). Japan: DPOL

E N D
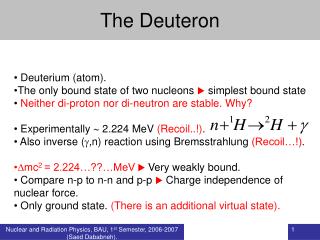
Deuteron polarimetry from 1.0 to 1.5 GeV/c Ed Stephenson, IUCF EDM discussion April 14, 2006 Based on work from: France: POMME B. Bonin et al. Nucl. Inst. Methods A288,389 (1990) V.P. Ladygin et al., Nucl. Inst. Methods A404, 129 (1998) Japan: DPOL Y. Satou, private communication Emphasizes elastic scattering Carbon target Want highest efficiency and vector spin dependence
A typical experimental layout contains: (φ=0) y left detector φ left and right detectors useful for vector polarization x θ z β beam direction target right detector scattering plane A polarization of the beam (p) causes a difference in the rates for scattering to the left according to: unpolarized cross section (determined by nuclear effects in scattering) governs efficiency analyzing power (determined by nuclear effects in scattering) governs spin sensitivity
POMME layout final scintillator trigger scintillators tracks from magnetic spectrometer wire chambers Iron absorber Carbon target Changes for EDM application: eliminate wire chambers (high rates) and segment final scintillator adjust carbon thickness to maximize efficiency (FOM) adjust iron thickness to favor elastic over breakup events
Functional polarimeter elements (must run continuously) Up Iron absorber Left Segmented scintillator Carbon target Right Angle range: 4° - 15° Carbon target is small. Down Left-right asymmetry carries EDM information. Detailed design awaits decision on bringing beam to polarimeter: slow extraction into second beam extract using jet in ring onto annular target tune beam onto annular target Down-up asymmetry carries information on g-2 precession.
Example: Rate considerations for feedback on phase (g-2 vs. sync.) Compare two inputs: BPM in dispersed region down-up asymmetry Bin asymmetry data into about 10 bins through one oscillation. Maximum asymmetry: Events needed: for δφ = 1%, N = 105 Then: load ring with 1011 deuteron lose half to polarimeter in 1000 s, target rate = 5 x 10⁷ /s with polarimeter efficiency at 6%, detector sees 3 x 10⁶ /s or 3 x 10⁵ /s/bin Can measure phase to 1% about 3 times per second.
Sample data: Bonin Satou Note differences in peak analyzing power !!! Bonin did not eliminate breakup as well. Satou did at the expense of efficiency.
At smaller angles Coulomb and multiple scattering dominate, making cross section large and analyzing power zero. 270-MeV deuteron elastic scattering – RIKEN [data example] (errors not shown) FIRST TRADE-OFF Optimize here: favor larger analyzing power, leverage against systematics Optimize here: favor statistical precision NEW DEFINITION OF FIGURE OF MERIT
The trade-off at high and low energies: 200 MeV At the higher energies, FOM and analyzing power peak together. There is no trade-off. 700 MeV FOM has two comparable peaks, so two options are equally good statistically. Thus higher analyzing power is favored.
Before optimizing the FOM as a function of energy, consider two other energy dependencies: The cross section is falling. More energy allows thicker targets. Dots = French data Line = curve used here
The SOLID dots and lines follow the FORWARD peak in the FOM curve. The open/dashed dots and lines follow the analyzing power peak (where there is enough data to use). The AVERAGES shown here integrate over some angle range that covers the relevant feature in FOM or iT11. SECOND TRADE-OFF: Satou gets even larger analyzing powers by cutting out more protons and losing “efficiency”. The FOM is down about 30% from the open dots.
What other sources arise for a left/right asymmetry? Polarimeter Systematic Errors 1 Displacement / angle errors detectors θ x θ angle shift position shift Usual remedy: measure on both sides (L/R) flip initial spin use cross ratio formula left/right efficiency differences cancel spin detector +/ luminosity differences cancel
Errors that are second-order in θ and u=p++p logarithmic derivatives of the analyzing power as a function of scattering angle Sizes of logarithmic derivatives need to be evaluated for some polarimeter acceptance geometry. We are helped by the small size of the asymmetry and the expected time dependence.