Download
1 / 39
390 likes | 416 Views
Dependent-Samples t-Test. Analyzing Two-sample Matched-Groups and Within-Subjects Designs. Independent Samples Design Different groups of participants receive different levels of the IV Each participant serves in only one condition Independent samples are used in each condition

E N D
Dependent-Samples t-Test Analyzing Two-sample Matched-Groups and Within-Subjects Designs
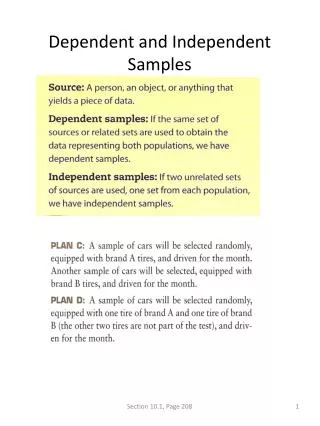
Independent Samples Design Different groups of participants receive different levels of the IV Each participant serves in only one condition Independent samples are used in each condition Participants are selected without regard to who is in the other condition Matched Samples Design Different groups of participants receive different levels of the IV Each participant serves in only one condition Dependentsamples are used in each condition Participants are matched to someone in the other condition on variable(s) correlated with the DV Comparison of Between-Subjects Designs: Independent and Matched Samples
Between-Subjects Design Different groups of participants receive different levels of the IV Each participant serves in only one condition of the IV Independent or matched samples are used in each condition Within-Subjects Design One group of participants receives every level of the IV Each participant serves in all conditions of the IV The same sample is used in each condition Comparison of Between-Subjects and Within-Subjects Design
Appropriate Statistics? • Independent-Samples Design independent-samples t test • Matched-Groups Design dependent-samples t test • Within-Subjects Design dependent-samples t test
Randomly selected samples DV normally distributed DV measured using ratio or interval scale Homogeneity of variance Requires dependent samples (and equal n’s) Randomly selected samples DV normally distributed DV measured using ratio or interval scale Homogeneity of variance Independent-Sample Dependent-Samplest-Testt-Test
General Model for z-Test and Single-Sample t-Test Original Population Sample H0 Treated Population HA
General Model for Independent-Samples t-Test H0: 1 - 2 = 0 Population A (Control/ Original) Sample A H0 Population B (Experimental/ Treated) Sample B
General Model for Independent-Samples t-Test HA: 1 - 2 0 Population A (Control/ Original) Sample A HA Population B (Experimental/ Treated) Sample B
Independent-Samples t-Test: compare the mean of Group 1 with the mean of Group 2 to determine if they are equal (H0) or different (HA) Dependent-Samples t-Test: 1. find the difference for each pair of scores (D = X1 – X2) 2. calculate the mean of the difference 3. determine if the mean difference differs from 0 General Model for Dependent-Samples t-Test
General Model for Dependent-Samples t-Test Difference Scores of Population A (Control/ Original) H0: μD = 0 Difference Scores of Population B (Experimental/ Treated) HA : μD ≠ 0
Definitional Formulas Single-Sample t-Test Dependent-Samples t-Test
t-Tests Formulas Single-Sample t-Test Dependent-Samples t-Test
Definitional Formulas Single-Sample t-Test Independent-Samples t-Test
Single-Sample Dependent-Samplest-Test t-Test Step 1: Step 2: Step 3:
Dependent-Samplest-Test Calculate the estimated variance of the population of difference scores Step 1: Step 2: Calculate the estimated standard error of the mean difference Step 3: Calculate t-obtained
Hypothesis Testing 1. State the hypotheses. 2. Set the significance level = .05. Determine tcrit. 3. Select and compute the appropriate statistic. 4. Make a decision. 5. Report the statistical results. 6. Write a conclusion.
An Example • Research Question: Which reinforcement schedule elicits more correct responses from pigeons? • A total of 16 pigeons from 8 clutches (2 pigeons from each clutch) • From each clutch, 1 pigeon is assigned to reinforcement schedule A and 1 is assigned to schedule B
Step 1. State the hypotheses. A. Is it a one-tailed or two-tailed test? • Two-tailed B. Research hypotheses • Alternative hypothesis: • Pigeons in Condition A will differ in the number of correct responses from pigeons in Condition B. • Null hypothesis: • Pigeons in Condition A will not differ in the number of correct responses from pigeons in Condition B. C. Statistical hypotheses: • HA: D≠ 0 • H0: D = 0
Step 2. Set the significance level = .05. Determine tcrit. Factors That Must Be Known to Find tcrit 1. Is it a one-tailed or a two-tailed test? • two-tailed 2. What is the alpha level? • .05 3. What are the degrees of freedom? • df = ?
df = n – 1 n = # of pairs Degrees of Freedom Single-Sample t-Test Dependent-Samples t-Test • df = n – 1 • n = # of scores
Example: df = n – 1 = 8 – 1 = 7 Degrees of Freedom Dependent-Samples t-Test
Step 3. Select and compute the appropriate statistic.Dependent-Samplest-Test Calculate the estimated variance of the population. Step 1: Step 2: Calculate the estimated standard error of the mean difference Step 3: Calculate t-obtained
Step 4. Make a decision. • Determine whether the value of the test statistic is in the critical region. Draw a picture. tcrit = ??? tcrit = ???
Step 4. Make a decision. • Determine whether the value of the test statistic is in the critical region. Draw a picture. • Decision? +tobt > +tcrit Reject Ho tcrit = +2.365 tcrit = -2.365 tobt = 2.76
Step 5. Report the statistical results. t(7) = 2.76, p < .05 Does this indicate that you retain or reject the null hypothesis? What does it mean to say that p < .05?
Step 6: Write a conclusion. • State the relationship between the IV and the DV in words: • Pigeons in Condition A (M = 6.25) made significantly more correct responses than pigeons in Condition B (M = 5), t(7) = 2.76, p < .05.
Step 6: Write a conclusion. • State the relationship between the IV and the DV in words: • Schedule A resulted in an average of M = 1.25 more correct responses than schedule B. There was a significant difference in performance between the two schedules, t(7) = 2.76, p < .05.
Effect Size dEffect Size 0.2 Small effect 0.5 Medium effect 0.8 Large effect
Step 8. Compute r2 and write a conclusion. • The reinforcement schedule can account for 52.11% of the variance in the difference in number of correct responses between the two conditions. Simpler: • The reinforcement schedule can account for 52.11% of the variance in the difference scores.
Percentage of Variance Explained (r2) r2Percentage of Variance Explained 0.01 Small effect 0.09 Medium effect 0.25 Large effect