Download
1 / 27
290 likes | 441 Views
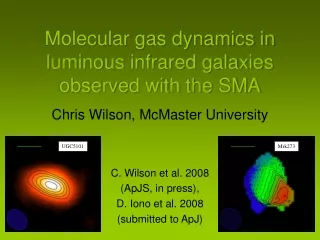
Luminous Infrared Galaxies with the Submillimeter Array: Probing the Extremes of Star Formation. Mrk273. UGC5101. Chris Wilson (McMaster), Glen Petitpas, Alison Peck, Melanie Krips (CfA), Brad Warren (McMaster),.

E N D
Luminous Infrared Galaxies with the Submillimeter Array: Probing the Extremes of Star Formation Mrk273 UGC5101 Chris Wilson (McMaster), Glen Petitpas, Alison Peck, Melanie Krips (CfA), Brad Warren (McMaster), Daisuke Iono (NAOJ), Andrew Baker (Rutgers), Paul Ho, Satoki Matsushita (ASIAA), T.J. Cox (CfA), Lee Armus (IPAC), Mika Juvela (Helsinki), Chris Mihos (Case Western), Ylva Pihlstrom (UNM), Min Yun (U.Mass), A. Atkinson, J. Golding (McMaster)
Luminous Infrared Galaxies with the Submillimeter Array • What are Luminous Infrared Galaxies? • An SMA Legacy Project: Gas Morphology and Dynamics in U/LIRGs • First results • gas-to-dust ratio • star formation versus gas concentration • comparison to high-redshift submillimeter galaxies
ULIRGS are galaxy mergers All galaxies with LFIR > 5x10¹¹ Lo are interacting or close pairs (Sanders et al. 1987) Figure from Galliano 2004 Scoville et al. 2000
Luminosity Source: Starbursts and AGN • 70-80% predominantly starbursts • 20-30% predominantly AGN Genzel et al. 1998
Dusty galaxies at high redshift: ULIRGs on steroids? • Cosmologically significant population of very luminous dusty galaxies discovered at submm wavelengths • For z>0.5, 5 mJy at 850 m implies L > 8x10¹² Lo Tacconi et al. 2006 Ivison et al. 2000
Gas Morphology and Dynamics in Luminous Infrared Galaxies: An SMA Legacy Project • Determine the distributions, kinematics, and physical conditionsof dense molecular gas in U/LIRGs • Determine the spatial distribution of dust in U/LIRGs • Constrain the origin of nuclear OH megamasers • Determine how the gas properties change as the interaction progresses • Compare the properties of the dense gas in local ULIRGs with the high-redshift submillimeter sources
The Submillimeter Array • 8 x 6m antennas, maximum baseline 500 m • Dual frequency operation at 230, 345, 690 GHz • 2 GHz bandwidth = 2600 km/s at 230 GHz • Angular resolution of our survey is 1-4” (CO 3-2 and 880 micron continuum)
Gas Morphology and Dynamics in Luminous Infrared Galaxies: Sample Selection • Representative sample of 14 luminous and ultraluminous infrared galaxies • DL < 200 Mpc (resolution 1” ~ 1 kpc) • log(LFIR) > 11.4 • All with previous interferometric observations in the CO J=1-0 line
Centrally compact CO 3-2 emission I10565+2448 Mrk231 Mrk273 UGC5101 Arp55 (HST images of Arp55 and I10565+2448 from Evans, Vavilkin, et al., 2007, in prep.)
But some systems are very extended • CO emission in VV114 shows three peaks spaced over 4 kpc (10”) • 5 out of 14 galaxies in our sample show two or more components
880 m continuum overlaid on CO3-2 Mrk273 I10565+2448 Mrk231 Contours are 2,3,4 … X 5 mJy/beam Field of view 4”x4”. All sources detected at4 sigma or better. UGC5101 Arp55(NE)
The Gas to Dust Mass Ratio • Mdust assumes = 0.9 cm2/g and Tdust from modified blackbody fit to global data from 60 to 800 m (cf. Klaas et al. 2001) • M(H2) = 0.8 L(CO1-0) (Downes & Solomon 1998); assume CO3-2/1-0=0.5 (our data) • Calculate gas to dust ratio in central beam only (CO much more sensitive than continuum per unit mass) • Average gas/dust ratio = 120 +/- 30 • Standard deviation 109: significant scatter
Peak H2 surface density correlates with LFIR/MH2 (Scoville et al. 1991)
Peak H2 surface density correlates with LFIR/MH2 (Scoville et al. 1991)
With more uniform spatial resolution, correlation disappears Log(LFIR/MH2) (Lo/Mo) Log(H2) (Mo pc-2)
Do see a correlation of peak H2 surface density with LFIR Log(H2) Log(LFIR)
Implications for star formation • No obvious correlation of star formation efficiency (LFIR/MH2) with peak H2 surface density • Possible correlation of star formation rate with peak H2 surface density • Suggests increased star formation rate/AGN activity in U/LIRGs is due to increased availability of fuel in central kiloparsec
Extremely high central gas surface densities • Peak gas surface densities range from 103 to 104 Mo/pc2 inside 0.5-1.2 kpc2 area • AV=70-700 mag • Average volume density at peak range from nH = 20 to 300 cm-3 • Estimated as (gas surface density) / (beam radius) • Average density is comparable to a GMC, but volume is 103-106 times larger • 1 kpc versus 10-100 pc
ULIRGs at low and high redshift Compare fourteen local galaxies with eight high-redshift galaxies; all in CO 3-2 (Tacconi et al. 2006, Downes & Solomon 2003, Genzel et al. 2003, Weiss et al. 2003) Compared to local galaxies, high-redshift galaxies • are at least an order of magnitude more luminous in CO 3-2 • LCO = 3.5x10¹⁰ versus 2.6x10⁹ K km/s pc2 • May have much larger FWHM diameters • 5 kpc versus 900 pc for nine galaxies • 5 local galaxies have two nuclei separated by 4-32 kpc • These galaxies are at faint luminosity end of our sample
Conclusions • A large survey of warm dense molecular gas in nearby luminous infrared galaxies shows • Gas to dust mass ratio very similar to Galaxy • Very high central gas surface densities and volume densities • Star formation rate (not efficiency) correlates with central gas surface density UGC5101 • Direct comparison of CO3-2 shows high-redshift submillimeter galaxies are more luminous and (perhaps) less centrally concentrated than local ULIRGs The Submillimeter Array is a joint project between the Smithsonian Astrophysical Observatory and the Academia Sinica Institute of Astronomy and Astrophysics and is funded by the Smithsonian Institution and the Academia Sinica.
Velocity Fields within R<1 kpc Mrk231 Mrk273 I10565+2448 UGC5101 Arp55(NE) Arp55(SW)
The Nearby Luminous Infrared Galaxy Sample (IRAS17208-0014, NGC6240 not shown)
Further analysis: an example • Combine CO 3-2, 2-1, and 1-0, and 13CO 2-1, to determine the physical properties of the molecular gas SMA data: Petitpas et al. 2006 Spitzer image: Wang et al. 2004
Further analysis (cont.) • Compare morphology and kinematics to numerical simulations to constrain merger age and establish a merger sequence • Correlate changes in gas physical properties with merger stage • Feed results on physical properties back into models to improve gas physics Narayanan et al. 2006
ALMA: Mass Function of Super-Giant Molecular Complexes SGMC mass function in the Antennae Wilson et al. 2003 ALMA will let us study molecular clouds and complexes in galaxies out to 200 Mpc - can reach masses as small as 5x10⁶ Mo at 200 Mpc in just one hour (3 sigma)