Download
1 / 41
410 likes | 566 Views
Efficient Use of Energy Physics Colloquium at UC Davis October 20, 2008. Arthur H. Rosenfeld, Commissioner California Energy Commission (916) 654-4930 ARosenfe@Energy.State.CA.US http://www.energy.ca.gov/commissioners/rosenfeld.html or just Google “ Art Rosenfeld ”. Some Background Reading.

E N D
Efficient Use of EnergyPhysics Colloquium at UC DavisOctober 20, 2008 Arthur H. Rosenfeld, Commissioner California Energy Commission (916) 654-4930 ARosenfe@Energy.State.CA.US http://www.energy.ca.gov/commissioners/rosenfeld.html or just Google “Art Rosenfeld”
Some Background Reading • For a Full (51 page) Biography of Dr. Rosenfeld, see his web site at: http://www.energy.ca.gov/commissioners/rosenfeld_docs/index.html • This Presentation Based on Work Published as: “Opportunities in the Building Sector: Managing Climate Change,” Rosenfeld, A. & McAuliffe, P., in Physics of Sustainable Energy: Using Energy Efficiently and Producing it Renewably, Edited by D. Hafemeister, et.al., American Institute of Physics Conference Proceedings, Vol. 1044, p. 3, 2008, College Park, MD The symposium is available at http://rael.berkeley.edu/files/apsenergy/
Two Energy Agencies in California The California Public Utilities Commission (CPUC) was formed in 1890 to regulate natural monopolies, like railroads, and later electric and gas utilities. The California Energy Commission (CEC) was formed in 1974 to regulate the environmental side of energy production and use. Now the two agencies work very closely, particularly to delay climate change. The Investor-Owned Utilities, under the guidance of the CPUC, spend “Public Goods Charge” money (rate-payer money) to do everything they can that is cost effective to beat existing standards. The Publicly-Owned utilities (20% of the power), under loose supervision by the CEC, do the same. 4
California Energy Commission Responsibilities Both Regulation and R&D • California Building and Appliance Standards • Started 1977 • Updated every few years • Siting Thermal Power Plants Larger than 50 MW • Forecasting Supply and Demand (electricity and fuels) • Research and Development • ~ $80 million per year • CPUC & CEC are collaborating to introduce communicating electric meters and thermostats that are programmable to respond to time-dependent electric tariffs.
Energy Intensity (E/GDP) in the United States (1949 - 2005) and France (1980 - 2003) 25.0 20.0 If intensity dropped at pre-1973 rate of 0.4%/year 12% of GDP = $1.7 Trillion in 2005 15.0 thousand Btu/$ (in $2000) Actual (E/GDP drops 2.1%/year) 10.0 7% of GDP = $1.0 Trillion In 2005 France 5.0 0.0 1949 1953 1957 1961 1965 1969 1973 1977 1981 1985 1989 1993 1997 2001 2005
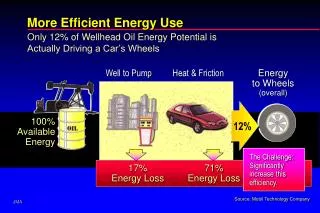
How Much of The Savings Come from Efficiency • Some examples of estimated savings in 2006 based on 1974 efficiencies minus 2006 efficiencies • Beginning in 2007 in California, reduction of “vampire” or stand-by losses • This will save $10 Billion when finally implemented, nation-wide • Out of a total $700 Billion, a crude summary is that 1/3 is structural, 1/3 is from transportation, and 1/3 from buildings and industry.
California’s Energy Action Plan • California’s Energy Agencies first adopted an Energy Action Plan in 2003. Central to this is the State’s preferred “Loading Order” for resource expansion. • 1. Energy efficiency and Demand Response • 2. Renewable Generation, • 3. Increased development of affordable & reliable conventional generation • 4. Transmission expansion to support all of California’s energy goals. • The Energy Action Plan has been updated since 2003 and provides overall policy direction to the various state agencies involved with the energy sectors
Impact of Standards on Efficiency of 3 Appliances 110 = Effective Dates of 100 National Standards Effective Dates of = State Standards 90 Gas Furnaces 80 75% 70 60% Index (1972 = 100) 60 Central A/C 50 SEER = 13 40 Refrigerators 30 25% 20 1972 1974 1976 1978 1980 1982 1984 1986 1988 1990 1992 1994 1996 1998 2000 2002 2004 2006 Year Source: S. Nadel, ACEEE, in ECEEE 2003 Summer Study, www.eceee.org
New United States Refrigerator Use v. Time and Retail Prices 2,000 25 1,800 1,600 20 1,400 $ 1,270 Refrigerator 1,200 15 Size (cubic ft) Average Annual Energy Use(kwh) or Price($) Refrigerator volume (cubic feet) 1,000 800 10 600 Energy Use per Refrigerator (kWh/Year) 400 5 Refrigerator Price $ 462 in 1983 $ 200 0 0 1947 1952 1957 1962 1967 1972 1977 1982 1987 1992 1997 2002 ~ 100 gallons Gasoline/year ~ 1 Ton CO2/year Source: David Goldstein
In the United States = 80 power plants of 500 MW each
Comparison of 3 Gorges to Refrigerator and AC Efficiency Improvements TWh Wholesale (3 Gorges) at 3.6 c/kWh Retail (AC + Ref) at 7.2 c/kWh Value of TWh 三峡电量与电冰箱、空调能效对比 120 7.5 100 If Energy Star Air Conditioners 空调 80 6.0 2005 Stds Air Conditioners 空调 TWH/Year Value (billion $/year) 2000 Stds 60 4.5 If Energy Star 3.0 40 Savings calculated 10 years after standard takes effect. Calculations provided by David Fridley, LBNL 2005 Stds Refrigerators 冰箱 20 1.5 2000 Stds 0 3 Gorges 三峡 Refrigerators 冰箱 3 Gorges 三峡 标准生效后,10年节约电量
California IOU’s Investment in Energy Efficiency Forecast Crisis Performance Incentives Profits decoupled from sales IRP Market Restructuring 2% of 2004 IOU Electric Revenues Public Goods Charges
To be published in Climatic Change 2008. • Global Cooling: Increasing World-wide Urban Albedos to Offset CO2 July 28, 2008 Hashem Akbari and Surabi Menon Lawrence Berkeley National Laboratory, USA H_Akbari@lbl.gov Tel: 510-486-4287 Arthur Rosenfeld California Energy Commission, USA Arosenfe@energy.state.ca.us Tel: 916-654 4930 • A First Step In Geo-Engineering Which Saves Money and Has Known Positive Environmental Impacts
1000 ft2 of a white roof, replacing a dark roof, offset the emission of 10 tonnes of CO2
CO2 Equivalency of Cool RoofsWorld-wide (Tropics+Temperate) • Cool Roofs alone offset 24 Gt CO2 • Worth > €600 Billion • To Convert 24 Gt CO2 one time into a rate • Assume 20 Year Program, thus 1.2 Gt CO2/year • Average World Car Emits 4 tCO2/year, equivalent to 300 Million Cars off the Road for 20 years. 23
AT UC DAVIS: • Daniel Sperling: Acting Director • Alan Meier: Associate Director and Faculty Researcher • Mark Modera: Director of the Western Cooling Efficiency Center • Michael Siminovitch: Director of the California Lighting Technology Center (CLTC)
Cool Roof Technologies New Old flat, white pitched, cool & colored pitched, white 28
CourtesyBASF Coatings Cool and Standard BrownMetal Roofing Panels • Solar reflectance ~ 0.2 higher • Afternoon surface temperature ~ 10ºC lower 30
cool concrete tile R ≥0.40 CourtesyAmericanRooftileCoatings standard concrete tile (same color) +0.37 +0.26 +0.23 +0.15 +0.29 +0.29 solar reflectance gain = cool clay tile R ≥0.40 CourtesyMCA Clay Tile cool metal R ≥0.30 CourtesyBASF IndustrialCoatings cool fiberglass asphalt shingleR ≥0.25 CourtesyElk Corporation Designing Cool Colored Roofing 31
Cool is Cool: From Cool Color Roofs to Cool Color Cars and Cool Jackets • Toyota experiment (surface temperature 10K cooler) • Ford is also working on the technology Courtesy: BMW (http://www.ips-innovations.com/solar_reflective_clothing.htm) 32
The End For More Information: http://www.energy.ca.gov/commissioners/rosenfeld_docs/index.html or just Google “Art Rosenfeld” 33
Reflective Pavements are Cooler • Fresh asphalt Albedo: 0.05 Temperature: 123°F • Aged asphalt Albedo: 0.15 Temperature: 115°F • Prototype asphalt coating Albedo: 0.51 Temperature: 88°F 35
Temperature Effect on Rutting 20 16 12 8 4 0 50°C (122°F) failure criterion Rut Depth (mm) 40°C (104°F) 507RF: 50°C 512RF: 40°C 120 80 40 160 0 Repetitions (thousands) Source: Dr. John Harvey, UC B Civil Engineering, Inst. Transpo. Studies 36
Potential Savings in LA • Savings for Los Angeles • Direct, $100M/year • Indirect, $70M/year • Smog, $360M/year • Estimate of national savings: $5B/year 38
Solar Reflective Surfaces Also Cool the Globe Source: IPCC 39
Effect of Solar Reflective Roofs and Pavements in Cooling the Globe (Source: Akbari et al. 2008, in press Climatic Change) • Increasing the solar reflectance of a m2 of roofs by 0.40 (white roof) is equivalent to offsetting 63 kg CO2 emissions(10 m2 of white roof = 1 T CO2 emission offset) • Increasing the solar reflectance of a m2 of roofs by 0.25 (cool roof) is equivalent to offsetting 63 kg CO2 emissions(16 m2 of cool roof = 1 T CO2 emission offset) • Increasing the solar reflectance of a m2 of paved surfaces by 0.15 is equivalent to offsetting 38 kg CO2 emissions • Total world-wide emission offset from cool roofs and cool pavements is 44 GT CO2 • 44 GT CO2 is over one year of the world 2025 emission of 37 GT CO2 • CO2 emissions currently trade at ~$25/T; 44 GT CO2worth $1100 billion 40
A Global Action Plan: The Big Picture • Develop an international to install cool roof/pavement in world’s100 largest cities • This is a simple measure that we hope to organize the world to implementAND • WE’D BETTER BE SUCCESSFUL! • We can gain practical experience in design of global measures to combat climate change 41