Download
1 / 23

E N D
ELECTRO-OCULOGRAPHY Dr S R Pati
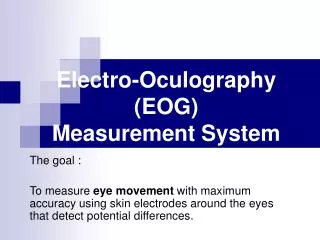
DEFINITION • The clinical electro-oculogram is an electrophysiological test of function of the outer retina and retinal pigment epithelium in which the change in the electrical potential between the cornea and the fundus is recorded during successive periods of dark and light adaptation.
HISTORY • Emil du Bois-Reymond (1848) observed that the cornea of the eye is electrically positive relative to the back of the eye. • Elwin Marg named the electrooculogram in 1951 and Geoffrey Arden (Arden et al. 1962) developed the first clinical application
The eye has a standing electrical potential between front and back, sometimes called the corneo-fundal potential. The potential is mainly derived from the retinal pigment epithelium (RPE), and it changes in response to retinal illumination • The potential decreases for 8–10 min in darkness. Subsequent retinal illumination causes an initial fall in the standing potential over 60–75 s (the fast oscillation (FO)), followed by a slow rise for 7–14 min (the light response). These phenomena arise from ion permeability changes across the basal RPE membrane.
The clinical electro-oculogram (EOG) makes an indirect measurement of the minimum amplitude of the standing potential in the dark and then again at its peak after the light rise. This is usually expressed as a ratio of ‘light peak to dark trough’ and referred to as the Arden ratio.
Measurement of the clinical EOG • The calibration of the signal may be achieved by having the patient look consecutively at two different fixation points located a known angle apart and recording the concomitant EOGs . • By attaching skin electrodes on both sides of an eye the potential can be measured by having the subject move his or her eyes horizontally a set distance . • Typical signal magnitudes range from 5-20 µV/°.
A ground electrode is attached usually to either the forehead or earlobe. • Either inside a Ganzfeld, or on a screen in front of the patient, small red fixation lights are place 30 degrees apart . • The distance the lights are separated is not critical for routine testing.
The patient should be light adapted such as in an well-illuminated room, and their eyes dilated • The patient keeps his or her head still while moving the eyes back and forth alternating between the two red lights. • The movement of the eyes produces a voltage swing of approximately 5 milli volts between the electrodes on each side of the eye, which is charted on graph paper or stored in the memory of a computer.
The standard method • After training the patient in the eye movements, the lights are turned off. • About every minute a sample of eye movement is taken as the patient is asked to look back and forth between the two lights . • After 15 minutes the lights are turned on and the patient is again asked about once a minute to move his or her eyes back and forth for about 10 seconds.
The standard method • Typically the voltage becomes a little smaller in the dark reaching its lowest potential after about 8-12 minutes, the so-called “dark trough”. • When the lights are turned on the potential rises, the light rise, reaching its peak in about 10 minutes. • When the size of the "light peak" is compared to the "dark trough" the relative size should be about 2:1 or greater . • A light/dark ratio of less than about 1.7 is considered abnormal.
APPLICATIONS • The light response is affected in: - diffuse disorders of the RPE and the photoreceptor layer of the retina including some characterized by rod dysfunction - chorio-retinal atrophic and inflammatory diseases • In most of these there is correlation with the electroretinogram (ERG), except notably in the case of Best’s vitelliform maculopathy, in which the clinical EOG is usually highly abnormal in the presence of a normal ERG • May be an early indicator of Chloroquine toxicity
BEST Disease • Sight loss can be variable but, like other macular problems, Best's disease threatens central vision in one or both eyes. • Within 5 identifiable stages, examination of the eye discloses a distinct progression. At first and second stages, there may be little or no effect on sight.
BEST Disease • Initially a recording of eye movements and eye position identifies abnormal electrical potential. • At the second stage (usually between 10-25 years of age), typical yellow spots, sometimes accompanied by material leaking into a space by the retina, can be observed; an observation called "egg-yolk" lesion. • When part of the lesion becomes absorbed this is identified as stage three. • At the fourth stage, when the "egg-yolk" breaks up, in a process referred to as "scrambled-egg", sight will probably be affected. • The fifth and final stage is when the condition causes the most severe sight loss.
Other diseases • The curves of the EOG of the depressed patients have lower amplitude. • The normalised mean EOG amplitudes obtained from a group of amblyopic eyes were significantly lower that the normalised mean amplitudes from the fellow eyes at all time points during the EOG recording • ↓ed Amplitude of EOG seen with use of : Mannitol,Acetazolamide,Bicarbonate