Download
1 / 29
290 likes | 396 Views
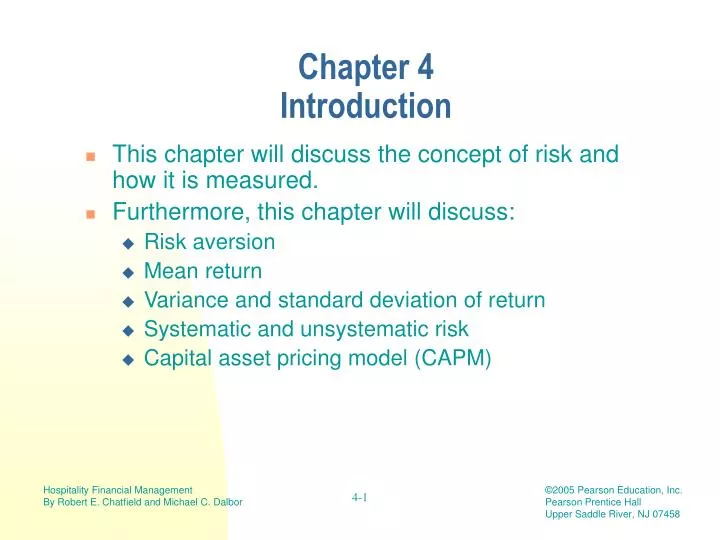
Chapter 4 Introduction. This chapter will discuss the concept of risk and how it is measured. Furthermore, this chapter will discuss: Risk aversion Mean return Variance and standard deviation of return Systematic and unsystematic risk Capital asset pricing model (CAPM). What is Risk?.

E N D
Chapter 4Introduction • This chapter will discuss the concept of risk and how it is measured. • Furthermore, this chapter will discuss: • Risk aversion • Mean return • Variance and standard deviation of return • Systematic and unsystematic risk • Capital asset pricing model (CAPM)
What is Risk? • Risk is the uncertainty that an outcome will vary from our expectations. • For an investment, it is the notion that cash flows or percentage returns will be different than our expectations. • This includes the “upside” potential as well as the “downside.” • As the potential outcomes widen, so does the risk.
Declining Marginal Utility for Money • “Who Wants to be a Millionaire” example • Why do most contestants stop and not “take a chance” for the $1 million question? • Because the potential utility gain is not as much as the utility lost from an incorrect answer (and loss of a major portion of their winnings up to that point)
Risk Aversion and Risk Averse Behavior • Does this mean we never take risks? • Risk aversion means that we must be compensated adequately for bearing risk. • This applies to returns for individual investors investing in stocks or bonds. • It also applies to companies deciding on investing in new projects for their shareholders.
Returns and Distributions • An example of a distribution is a potential distribution of dividends. • Each potential dividend is an outcome. • Each outcome has a probability of occurrence associated with it. • Expected return = average return • Simple average vs. weighted average
What is the Expected Dividend for the Following Distribution?
Expected Value Calculation • ($10 + $7 + $5 + $3 + $1)/5 = $5.20 • This is incorrect! • ($10 x .10) + ($7 x .20) + ($5 x .40) + ($3 x .20) + ($1 x .10) = $5.10 • We have an expected outcome (mean) and a number of outcomes around the mean. • This is called a distribution. • A normal “bell-shaped” curve has half the outcomes to the right of the mean.
What Can a Distribution Tell Us? • In this example, the shape of the distribution tells us about the risk of the investment. • Variance is a measure of risk. • The variance examines the differences between each outcome and the expected value. • Variance is a positive number. • In general form, variance is the sum of: ((Outcome 1 – expected value)2 x probability of outcome 1)) + ((Outcome 2 – expected value)2 x probability of outcome 2))+… ((Outcome n – expected value)2 x probability of outcome n))
Variance and Standard Deviation • The variance for the previously shown dividend distribution is $5.68. • In order to make the interpretation more useful, we take the square root of the variance. • This is called the standard deviation. • The standard deviation in this example is $2.38.
The Normal Distribution • For a distribution to be normal, 68.3% of the observations must be between one standard deviation subtracted from the mean and one standard deviation added to the mean. • In this example, one standard deviation from the mean ranges from $2.72 and $7.48. • Thus, on average, we would expect to receive a dividend from between $2.72 and $7.48 approximately 2/3 of the time.
Standard Deviation and Risk Aversion • Standard deviation is an indication of the risk of the investment. • Given that most people are risk averse, what can we say about investments and their standard deviations? • If investment A and investment B have the same expected return, but investment B has a higher standard deviation, which investment would you choose? Why?
Coefficient of Variation • Suppose two investments have different expected returns and different standard deviations. • How do we know which one to choose? • Coefficient of variation = standard deviation / expected return. • The risk averse investor will choose the lowest risk for the greater return and thus, the lower ratio.
Diversification • The concept of a portfolio: • A financial portfolio is a collection of two or more assets. • Why do investors hold more than one asset? • “Don’t put all your eggs in one basket.” • Investors hold more than one asset in order to be diversified. • Investors diversify to improve or hold returns constant and reduce overall risk.
Diversification (continued) • If we have two assets that are very similar, they could both increase or both decrease. • What does risk aversion tell us about these alternatives? • If we have two assets that are different, we can maintain a return by holding them simultaneously—if one decreases, the other increases.
Correlation • How do we know if the returns of two assets move in the same direction (or not)? • Correlation coefficient • Abbreviated (lowercase Greek or “rho”) • A statistical measure of the relationship between two variables • What kind of relationship would you expect to find between the amount of rainfall and umbrella sales? • In this case, would be positive
Correlation (continued) • The correlation coefficient ranges from –1.0 to +1.0. • If two assets have returns that move together in perfect lockstep, we can say their returns have a rho of +1.0. • If they move in exactly opposite directions, then the rho of their returns is –1.0. • Given what you know about portfolios, the ideal pair of assets would have a rho of _____.
Correlation and Risk • If the correlation coefficient of the returns of two assets is +1.0, then the standard deviation (risk) of the portfolio is simply the weighted average of the standard deviations of the two assets. • Thus, there is no risk reduction in this case. • There would be no benefit from holding these two assets in portfolio.
Correlation and Risk (continued) • On the other hand, what happens if we find two assets with a correlation of –1.0? • Risk would be completely eliminated. • The standard deviation of the portfolio would be 0. • What is the likelihood of finding two assets with perfect negative correlation? • It is rare if not impossible. • However, all we have to find is two assets with correlation of less than +1.0 to achieve some benefits of risk reduction.
The Market Portfolio • If we are very risk averse, can we hold an asset that has no risk? • Risk-free asset has a guaranteed return. • An example would be a security issued by the U.S. Government, such as a treasury bill. • If the return is guaranteed, what is the standard deviation of the return for the risk-free asset?
The Market Portfolio (continued) • The market portfolio is a theoretical portfolio comprising all assets in the appropriate proportion. • It is the most “efficient.” • It provides the most return for a given level of risk. • Since the market portfolio is the best portfolio in terms of risk and return, we must assume investors will own it.
The Capital Market Line • Depending on risk preferences, investors can invest part of their funds in the risk-free asset and part in the market portfolio. • They could also increase their return (but also the risk) by holding the market portfolio and borrowing funds. • The line that extends from the risk-free asset through the market portfolio is called the capital market line.
Risk and Its Components Systematic Risk + Unsystematic Risk = Total Risk • Systematic risk relates to those factors that affect all assets in the market. • Unsystematic risk relates to those factors that are specific to a particular asset. • The market portfolio is so diversified that all unsystematic risk is removed as assets are added to it. • Therefore, the only risk in the market portfolio is systematic.
How Can We Hold the Market Portfolio? • Do we need to hold all the assets in the world to obtain the benefits of the market portfolio? • Research indicates that if we have approximately 30 assets in a portfolio we will have obtained the maximum benefit from diversification. • Investors hold a “proxy” for the market portfolio—a mutual fund such as the S&P 500 index fund.
What is the Relevant Risk of New Assets? • We assume investors are diversified and hold a proxy for the market portfolio. • Therefore, the only risk component relevant to them is the systematic risk because the unsystematic risk of an investment will be diversified away. • Total risk (standard deviation) includes both types of risk. • Is there a measure of systematic risk?
Beta • Beta is the measure of an asset’s systematic risk relative to the market portfolio. • Beta = xmx / m • It is found by multiplying the correlation coefficient of any asset (asset x) and the market portfolio by the standard deviation of asset x. This product is divided by the standard deviation of the market portfolio.
Beta (continued) • Betas are compared to the overall market. • The market portfolio has a beta of 1. • If the stock of a company has a beta of 2, it is twice as risky as the market. • Where can I find betas? • Use linear regression • Yahoo! Finance website • Various brokerage firm websites
Beta as a Predictive Tool • The capital market line examines return versus total risk. • The security market line (SML) measures return of a security against beta. • The SML represents a minimum expected return given the relevant risk of a security. Expected Return = Rf + [(Rm – Rf) x ]
The Capital Asset Pricing Model • The SML is an equation for a straight line. • Beta is the slope of the line. • This is also known as the Capital Asset Pricing Model (CAPM). • If a project generates a return higher than the required rate of return as shown by the SML, value is created and the project is accepted. If not, then value is lost and the project should be rejected.
Limitations of CAPM • The CAPM cannot always predict the returns of assets accurately and it has limitations. • The market portfolio is a theoretical concept; no consensus on which proxy for the market portfolio is best. • Betas are calculated based upon historical returns and then used to predict future returns. • Despite the limitations, CAPM is useful in getting investors to understand a fundamental relationship between risk and return.