Download
1 / 11
110 likes | 114 Views
This process analysis focuses on the flow rate, inventory, and time spent by passengers at the Vancouver Airport security checkpoint. It analyzes the inflow and outflow rates to determine process stability and identifies potential areas for optimization.

E N D
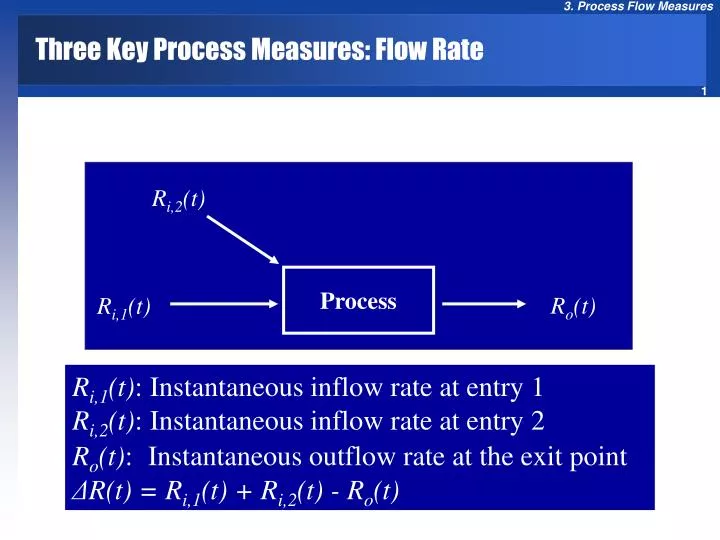
Ri,2(t) Process • Ro(t) • Ri,1(t) Three Key Process Measures: Flow Rate Ri,1(t): Instantaneous inflow rate at entry 1 Ri,2(t): Instantaneous inflow rate at entry 2 Ro(t):Instantaneous outflow rate at the exit point ΔR(t) = Ri,1(t) + Ri,2(t) - Ro(t)
Three Key Process Measures: Vancouver Airport Flow unit = Passenger Flow time = Total time spent by a passenger within security process boundaries Flow rate = the number of passengers leaving the checkpoint Inventory = the number of passengers within process boundaries at time t When Ri(t) > Ro(t) I(t) increases Each flight has 200 passengers. If Ri(t) is 15 passengers/min, since Ro(t) can not exceed 12 passengers/min, then inventory increases.
Vancouver International Airport Three flights at the start of each hour. The first flight is at 10 am. 50% of passengers arrive over a 20-minute time interval, 50 to 30 minutes before departure. For all three flights 0.5(200)(3) = 300 passengers will arrive uniformly between9:10 - 9:30. Inflow rate = 300/20 =15 passengers per minute. The remaining passengers arrive in a 40 minutes time interval either 80 to 50 minutes or 30 to 20 minutes before departure. Therefore, between8:40 - 9:10and between9:30 - 9:40the inflow rate is 300/40 =7.5 passengers per minute.
Ri=15/min Ri =Ro= 7.5/min Ri <Ro =7.5/min Ro=12/min Inventory Build up Diagram for Vancouver Airport Security Checkpoint Cumulative in and outflow (passengers) ∆R=0/min 700 600 500 ∆R=-4.5/min Tdeplete = 60/4.5 = 13.33 min 400 ∆R=3/min Imax = 3(20)=60 300 200 ∆R=0/min 100 0 8:40 9:00 9:20 9:40 10:00 Time
Average Inventory in a Stable Process 8:40-9:10: Ri= Ro I1 = 0 9:10-9:30: Ri= 15, Ro=12 IMax = 3(20) = 60 Inventory is then depleted at rate of (12-7.5) = 4.5 60/4.5 = 13.33 9:30 + 13.33 = 9:43 ΔR=3/min ΔR= - 4.5/min ΔR=0/min ΔR=0/min 33 minutes 9:43 9:10 10:00 8:40 9:10-9:43: Average inventory = I2 = 60/2 = 30 passengers Cycle repeats itself every hour, I2=30 during 33 minutes and I1=0 during 27 minutes
:00 :10 :43 :00 :00 :00 :10 :10 :10 :43 :43 :43 Average Inventory in a Stable Process Cycle repeats itself every hour, I2=30 during 33 minutes and I1=0 during 27 minutes If you also want to take into account 8:40 to 9:00, and if the last three flights are at 10 p.m., then I = (12 ×17.5 +0.33 ×0)/12.33 = 17.03
Is the Security Checkpoint a stable Process? A Stable Process • In a Stable Process • Average outflow capacity must be greater than average inflow rate, while average inventory is not zero. • Average inflow rate is the same as average outflow rate. • Throughput (R) is the average flow rate • Ideally, R should be equal to the customer demand. Scanner can handle 12 passengers per minute It can easily handle inflow Average inflow rate is 600 passengers/hr, or 10 passengers/min
Re-Scheduling the Flight: 0, 20, and 40 Minutes After Hour Inflow Rates with Staggered Departures for Vancouver Airport Security Checkpoint If flight departures are staggered, the peaks and valleys in arrival rates for different flights cancel each other out as illustrated in this table
Problem 3.7, MBPF Orange Juice Inc. produces and markets fruit juice. During the orange harvest season, trucks bring oranges from the fields to the processing plant during a workday that runs from 7 a.m. to 6 p.m. On peak days, approximately 10,000 kilograms or oranges are trucked in per hour. Trucks dump their contents in a holding bin with a storage capacity of 6,000 kilograms. When the bin is full, incoming trucks must wait until it has sufficient available space. A conveyor moves oranges from the bins to the processing plant. The plant is configured to deal with an average harvesting day, and maximum throughput (flow rate) is 8,000 kilograms per hour. Assuming that oranges arrive continuously over time, construct an inventory buildup diagram for Orange Juice Inc. In order to process all the oranges delivered during the day, how long must the plant operate on peak days? (Assume, too, that because Orange Juice Inc. makes fresh juice, it cannot store oranges.) Assuming, finally, that each truck holds about 1,000 kilograms of oranges, at what point during the day must a truck first wait before unloading into the storage bin? What is the maximum amount of time that a truck must wait? How long will trucks wait on average? Among trucks that do wait, how long is the average wait?
Directions • o) Assume a truck as your flow unit. • a) How long must the plant operate on peak days? • b) At what point during the day must a truck first wait before unloading into the storage bin? • c) What is the maximum amount of time that a truck must wait? • d) Among trucks that wait, how long is the average wait? • e) How long a truck wait on the average?