Download

1 / 33
340 likes | 491 Views
Forensic Analysis Why Did This Field Die? Presented at Western Australia Section of SPE June 19, 2012 Perth, Australia Dr. Bill Cobb William M. Cobb & Associates, Inc. Petroleum Engineering & Geological Consultants Dallas, Texas. Why Did This Oil Field Die?. Every Field is Different!

E N D
Forensic Analysis Why Did This Field Die? Presented at Western Australia Section of SPE June 19, 2012 Perth, Australia Dr. Bill Cobb William M. Cobb & Associates, Inc. Petroleum Engineering & Geological Consultants Dallas, Texas
Why Did This Oil Field Die? Every Field is Different! Reservoir Drive Mechanism PRIMARY Rock & Liquid Expansion Above the Bubble Point SOLUTION GAS DRIVE Initial Gas Cap Expansion - Size Aquifer Influx – Size WATERFLOODING CO2, Steam, Polymer, Other
PRIMARY RECOVERY VS WF Solution gas drive requires the reservoir pressure to be constantly decreasing WF is a displacement process and is most efficient when reservoir pressure is maintained or increased When converting from primary to waterflooding or any type of fluid injection, the reservoir recovery mechanism changes. Consequently reservoir evaluation and reservoir management procedures generally need to be changed
THIS PRESENTATION IS THE FORENSIC ANALYSIS OF A DEAD OR DYING WATERFLOOD WHERE PRIMARY PRODUCTION WAS FROM SOLUTION GAS • Can we learn lessons that may help us resuscitate the WF or guide us if we move to a tertiary project? • Why did the project die? • Where do we start? • What does the evidence say?
NP = Cumulative Waterflood Recovery, BBL. N = Oil in Place at Start of Injection, BBL. EA = Areal Sweep Efficiency, Fraction EV = Vertical Sweep Efficiency, Fraction ED = Displacement Efficiency, Fraction What are the Key Factors that Drive the Outcome of a Water Injection Project?
EA = f (MR, Pattern, Directional Permeability, Pressure Distribution, Cumulative Injection & Operations) EV = f (Rock Property variation between different flow units, Cross-flow, MR) EVOL = Volumetric Sweep of the Reservoir by Injected Water ED = f (Primary Depletion, So, So, Krw & Kro, μo & μw) WATERFLOOD RECOVERY FACTOR
Recognize the recovery mechanism has changed. The driver of the waterflood is the injection well. The injector is the Quarterback of the operation. Efficient utilization of the injector maximizes volumetric sweep. (The fraction of the reservoir contacted by the injected water). TO MAXIMIZE WATERFLOOD OIL RECOVERY
THE QUARTERBACK OF ALL INJECTION PROJECTS IS THE INJECTION WELL Properly locatedinjection wells are A significant key to A successful waterflood: • They deliver the water where it needs to be injected • They deliver the water at the correct time • They deliver the water in the proper volume • Effective utilization of injection wells is an important key to optimizing the WF by allowing EA and EV values and RF to be maximized • Failure to properly locate and manage the injectors will result in a less efficient injection project and could lead to failure.
DID THIS WATERFLOOD DIE AND FAIL TO PRODUCE EXPECTED WF OIL? • Did this project meet a premature high water cut death? If the answer is yes, some of the reasons for failure are likely due to: • Lack of significant movable oil saturation at the start of injection – low ED • High initial free gas saturation leading to a small or negligible oil bank and long gas fill-up time • Floodable net pay is overstated (same porosity cutoff used for WF as used for primary depletion) • Poor volumetric sweep – low EVOL
Static OOIP Dynamic OOIP Drive mechanism – primary vs secondary Waterflood net pay cutoffs controlled by: Water Cut Economic Limit Permeability Distribution between Flow Units (Dykstra-Parson Coefficient) Oil/Water Relative Permeability Mobility Ratio (Oil and Water Viscosity) Fluid Saturations at Start of Injection (So, Sg, Swc) * See SPE #48952 and SPE #123561 NET PAY
WF VOLUMETRIC SWEEP USING OIL PRODUCTION DATA SINCE START OF INJECTION * See SPE #38902
Cont'd – WATERFLOOD FAILURES MAYBE DUE TO: VRR less than 1.0 and pressure declines High variation in permeability between geological layers causing the high permeability layers to water out the producing wells before the lower perm layers Contribute meaningful waterflood production Failure to develop a pattern Failure to recognize and honor KXand KYtrends Failure to keep fluid levels pumped off in producing wells Mechanical integrity of injection wells to control vertical distribution of injected water
ASIAN WATERFLOOD WATER INJECTION RESPONSE
WF WAS NOT SUCCESSFULWHAT SHOULD BE CONSIDERED? • Compute So and Sg at start of waterflood • Compute WF volumetric sweep efficiency • Re-evaluate net pay cutoffs • Check for high permeability thief zones • Check VRR since start of injection • Consider infill drilling • Realign pattern – this could violate the 11thcommandment • Is it a candidate for horizontal producers?
WATERFLOOD LESSONS LEARNED Every field is different There are almost no analogy floods Need high movable oil saturation Need low free gas from solution Prefer low oil viscosity (high viscosity oils can be produced by cycling large volumes of water). Pattern highly desirable Honor KX/KY Effective VRR since injection start equals 1.0 or more for each pattern and key geological zones
LESSONS LEARNED Cont'd • Careful attention given to selection of net pay cutoffs. NET PAY FOR WATERFLOOD IS LESS THAN NET PAY FOR PRIMARY DEPLETION. • Keep fluid levels in producing wells pumped off • Accurately test each producing well monthly for oil, water and gas. • Maintain production plots on a well by well basis. Combining wells into groups is equivalent to combining “The Good, The Bad and The Ugly”.
LESSONS LEARNED Cont'd • Forecasting the future production should be performed on a well by well basis. • Typical plots of oil rate vs time or oil rates vs cumulative oil produced should be used with extreme caution because oil rates are directly related to injection rates and injection rate changes and stratification. • Semi-log plots of WOR vs cumulative oil produced are likely to be more reliable because WOR is largely independent of injection rate and injection rate changes. • Analysis of WOR plots is most reliable when forecasts are made using WOR values which exceed 2.0 to 3.0 • Reliable well forecasts require accurate well tests
LESSONS LEARNED Cont'd • Conduct regular injection profiles to monitor the amount of water going into various zones. • Thief zones must be identified and isolated or oil production will occur at high water cuts. • REMEMBER THE QUARTERBACK
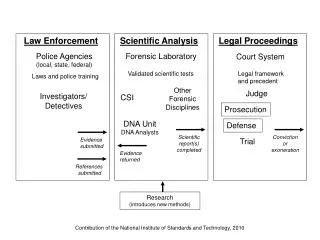
HONOR THE DATA • Every field is different • The reservoir speaks to us – are we listening? • Data costs money • Lack of quality geological, reservoir and production data usually leads to inefficient operations or early failure. • Lack of relevant data puts the geoscientist, reservoir or operational analyst into a position where he/she must trust experiences, instincts, hunches and wishful thinking. • “People are not always truthful – the evidence does not lie.” – from Gil Grissom of CSI • Become an OFI – Oil Field Investigator – follow the evidence
WHEN ALL ELSE FAILS, A POTENTIAL WATERFLOOD ANALYSIS METHOD IS: DOES IT FUNCTION? NO YES DID YOU TRY TO FIX IT? DON’T CHANGE IT YES YOU IDIOT! NO DOES ANYBODY KNOW ABOUT IT? ARE YOU GOING TO BE IN TROUBLE? YES YES YOU POOR BASTARD! CAN YOU BLAME SOMEONE ELSE? NO NO NO PRETEND YOU DON’T KNOW ABOUT IT! HIDE IT YES THEN, THERE IS NO PROBLEM
Forensic Analysis Why Did This Field Die? Presented at The Dallas E & P Forum December 13, 2011 Sponsored By SIPES and SPE Dr. William M. Cobb William M. Cobb & Associates, Inc. Petroleum Engineering & Geological Consultants Dallas, Texas
Assume Gas fill-up has been achieved (reservoir Contains oil and water Reservoir pressure is approximately constant (Bo is constant) Steady state flow prevails (approximately) Conclusion Effective Water Injection = Liquid Production (at Reservoir Conditions) DECLINE CURVE ANALYSIS
DECLINE CURVE ANALYSIS Conclusion Oil and Water Production Rates are directly related to injection rates. Therefore, DCA of qo vs t or qo vs NP must be evaluated only after giving consideration to historical and projected water injection rates.
WOR IS INDEPENDENT OF INJECTION RATE • Conclusion • WOR is independent of injection rate • Other Points • WOR should be applied to individual wells and not field • WOR should be applied using values greater than 2.0