Download
1 / 21
210 likes | 211 Views
This study explores the geometrical placement of the Fe II emission region in AGN, investigates the mechanisms of excitation, and examines correlations with other AGN properties.

E N D
Fe II emission region in Active Galactic Nuclei J. Kovačević, L. Č. Popović and M. S. Dimitrijević Astronomical Observatory Belgrade
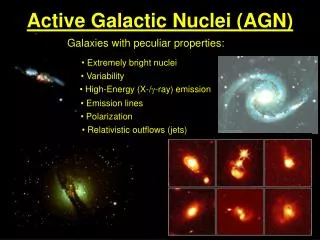
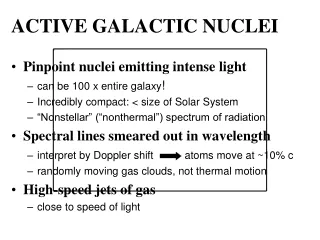
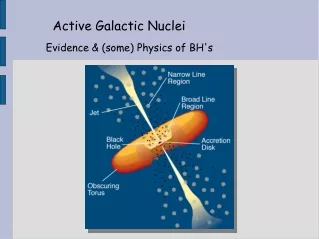
1. AGN emission regions Narrow Line Region - NLR Broad Line Region - BLR Dusty tourus Fe II Accretion disk and black hole jet
Fe II λλ 4450-5350 Ǻ emission lines • Open questions: 1. Geometrical place of Fe II emission region in AGN structure ? 2. Mechanism of excitation? 3. Unexplained correlations among Fe II lines and some AGN properties ? Hβ Intensity Wavelength
1. Geometrical place of Fe II emission region in AGN structure ? • Fe II lines arise in same emission region as broad component of Hβ line (Boroson & Green 1992); • In accretion disc near central black hole, where double-peak Balmer emission lines are produced (Zhang et al. 2006). • In Intermediate Line Region (ILR), which is placed between Narrow and Broad Line Region (Chen Hu et al. 2008).
2. Mechanism of excitation ? • Extreme Fe II emission can not be explained with standard photoionization models. Those models may account only for line ratio Fe II 4570/Hβ < 6, but in observed spectra it goes from 0 to 30. • Proposed additional mechanism of excitation: - continuum fluorescence(Phillips 1978, 1979); - collision excitation(Joly 1981, 1987, 1991; Veron et al. 2006); - self-fluorescence among Fe II transitions(Netzer & Wills 1983) - fluorescent excitation by Lyα and Lyβ lines(Penston 1988)
3. Physical cause of correlations among Fe II and other AGN properties ? If than EW Fe II is strong weak Lcont is strong weak EW [O III] weak strong EW C IV weak strong blueshift CIV strong weak BLR width narrow broad BLR asymmetry blue none or red X-ray luminosity weak strong X-ray slope steep flat Radio luminosity RQ RL Radio slope flat (CD) steep (LD) IR luminosity strong weak Searching for physical causes of these correlations may help in understanding Fe II lines origin
Proposed physical explanations: • L/LEdd(Boroson & Green 1992, Baskin & Laor 2004) • Inclination angle (Miley & Miller 1979, Wills & Browne 1986, Marziani et al. 2001) • L/LEdd , inclination angle and MBH (Boroson 2002)
Our goal: • We separate Fe II lines into three groups, according to their lower level of transition (4F,6S and 4G) • We analyze relations of each group with other lines in AGN spectra, connecting Fe II atom structure with AGN physical properties
The sample and analysis • We selected 111 AGN spectra from SDSS ( DR6), using criteria: S/N<20, z<0.7; • Spectra are corrected for Galactic reddening, and continuum is removed; • We fit lines with sum of Gaussians, using χ2 minimalization routine. Two spectral ranges are considered: 1. λλ4400-5500 Ǻ ( Fe II, [O III] λλ4959, 5007 Ǻ, He II λ4686 and Hβ ) 2. λλ6400-6800 Ǻ (Hα and [N II] λλ 6548, 6583 Ǻ)
Fitting procedure NLR VBLR ILR • Balmer lines (Hα and Hβ) - arise from three emission regions: NLR (Narrow Line Region) ILR (Intermediate Line Region) VBLR (Very Broad Line Region) 3 Gaussians! • All narrow lines ([O III], [N II] and narrow Hα and Hβ) have the same shifts and widths (they all originate from NLR) • Fe II is fitted with calculated template
Fe II template In order to calculate the template, we used the strongest 29 Fe II lines in λλ4450-5350 Ǻ range; We separated them into three line groups according lower level of transition: • 3d6 (3F2)4s4F (18 lines) • 3d5 4s26S (5 lines) • d6 (3G)4s 4G (6 lines) 4G 6S 4F
Fe II template Fe II lines are represented with Gaussians which widths (WD/λ) and shifts (d/ λ) are identical (because they originate from the same emission region), but their intensities are different. Relative intensities of lines within each group (lines with same lower level of transition) are calculated by formula: Hβ Template is described by 6 parameters of fit: electron temperature, width, shift and three parameters of intensity for each line group (4F, 6S and 4G). I1 and I2 – line intensities, g1 and g2 – statistical weights, f1 and f2 - oscillator srengths, E1 and E2 –energies of upper level of transitions, k - Boltzman constant, T-electron temperature;
Results:1. Correlations among 4F, 6S and 4G Fe II line groups
Strongercorrelations among 4F and 4G line groups, than with 6S! - probably caused by complex Fe II structure, i.e. divers multiplicity: 4 (4F and 4G) and 6 (6S)
Results:2. Geometrical place of Fe II emission region in AGN structure b a a b
Relations among Fe II width and the widths of NLR, ILR and VBLR Hβ and Hα components Hb Ha b a Ha a
Relations among the shift of Fe II and the shifts of NLR, ILR and VBLR Hβ and Hα components a b Trends between kinematical properties (widths and shifts) of Fe II and ILR Hα and Hβcomponents: Confirmation that Fe II emission region is located in ILR!
Results:3. Luminosities of Fe II line groups (4F, 6S and 4G) vs. luminosities of other lines (Ha, Hb, [N II], [O III]) . NLR - We found significant correlation among Fe II and Ha, Hb and [N II], but we found no correlation in case of [O III].
Conclusions: • Identical multiplicity of lower level of transitions of 4F and 4G Fe II line groups reflects through stronger correlations among these groups than with 6S. • Observed trends between shifts and widths of Fe II and ILR Hα (Hβ) components indicate possible physical and kinematical linkage of Fe II emission region and ILR. • Strong correlations among Fe II luminosity and luminosities of other considered lines are observed, except for [O III], which requires physical explanation!