Download
1 / 23
230 likes | 392 Views
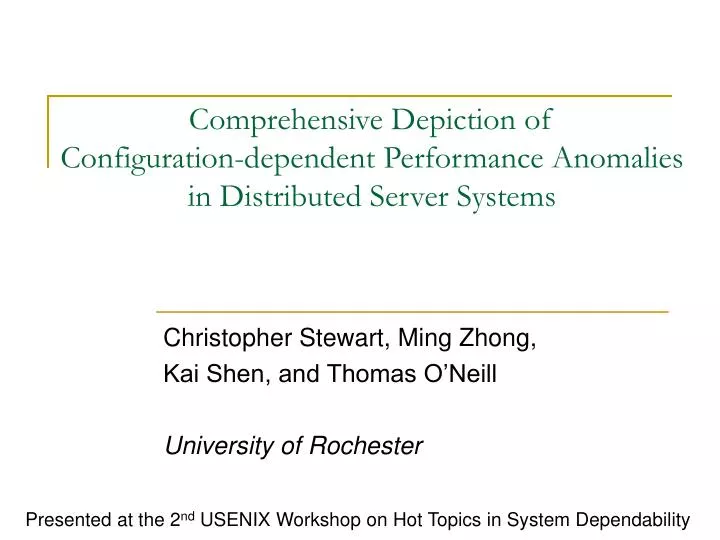
Comprehensive Depiction of Configuration-dependent Performance Anomalies in Distributed Server Systems. Christopher Stewart, Ming Zhong, Kai Shen, and Thomas O’Neill University of Rochester. Presented at the 2 nd USENIX Workshop on Hot Topics in System Dependability. Context.

E N D
Comprehensive Depiction of Configuration-dependent Performance Anomalies in Distributed Server Systems Christopher Stewart, Ming Zhong, Kai Shen, and Thomas O’Neill University of Rochester Presented at the 2nd USENIX Workshop on Hot Topics in System Dependability
Context • Distributed server systems • Example: J2EE Application servers • Many system configurations • Switches that control runtime execution • Wide range of workload conditions • exogenous demands for system resources Example J2EE Runtime Conditions System Configurations Concurrency limit Component placement Workload Conditions Request rate
Presumptions • Performance expectations based on knowledge of system design are reasonable • Lead developers–high-level algorithms • Administrators–day-to-day experience Example Expectation Little’s Law Average number of requests in the system equals the average arrival rate times service time
Real Performance Anomalies Expectation Actual Throughput Anomalies Component Placement Strategies Problem Statement • Dependable performance is important for system management • QoS scheduling • SLA negotiations • Performance Anomalies – runtime conditions in which performance falls below expectations – are not uncommon
Goals • Previous Work: Anomaly characterization can aid the debugging process and guide online avoidance • [AGU-SOSP99, QUI-SOSP05, CHE-NSDI04, COH-SOSP05, KEL-WORLDS05] • Focused on specific runtime conditions (e.g., those encountered during a particular execution) We wish to depict all anomalous conditions • Comprehensive depictions can: • Aid the debugging of production systems before distribution • Enable preemptive avoidance of anomalies in live systems
Approach • Our depictions are derived in a 3-step process: • Generate performance expectations by building a comprehensive whole-system performance model • Search for anomalous runtime conditions • Extrapolate a comprehensive anomaly depiction • Challenges: • Model must consider a wide-range of system configurations • Systematic method to determine anomaly error threshold • An appropriate method to detect correlations between runtime conditions and anomalies
Outline • Performance expectations for a wide-range of configuration settings • Determination of the anomaly error threshold • Decision-tree based anomaly depiction • Preliminary results • Discussion/ Conclusion
Comprehensive Performance Expectations • Modeling the configuration space is hard • Configurations have complex effects on performance • Considering a wide-range of configurations increases model complexity • Our modeling methodology • Build performance models as a hierarchy of sub-models • Sub-models can be independently adjusted to consider new system configurations
Rules for Our Sub-Model Hierarchies • The output of each sub-model is a workload property • Workload property – internal demands for resources (e.g., CPU consumption) • The inputs to each sub-model are either • workload properties • system configuration settings • Sub-models on the highest level produce performance expectations • Workload properties at the lowest level, canonical workload properties, can be measured independent of system configurations
Hierarchy of sub-models for J2EE application servers. A Hierarchy of Sub-Models • We leverage the workload properties of earlier work[STE-NSDI05] • Advantages • Sub-models have meaning • Limitations • Configuration dependencies may make sub-models complex
Outline • Performance expectations for a wide-range of configuration settings • Determination of the anomaly error threshold • Decision-tree based anomaly depiction • Preliminary results • Discussion/ Conclusion
Determination of the Anomaly Error Threshold • Sometimes slight discrepancies between actual and expected performance should be tolerated • Leniency depends on the end-use of the depiction • For online avoidance:focus on error magnitude • Large errors may induce poor management decisions • Sensitivity analysis of system management functions • For debugging:focus on targeted performance bugs • Noisy depictions will mislead debuggers • Group anomalies with the same root cause
Anomaly Error Threshold for Debugging • Observation: anomaly manifestations due to the same cause are more likely to share similar error magnitude than unrelated anomaly manifestations • Root causes can be grouped by clustering based on the expectation error:
100% Response Time 80% knee Tput 60% knee knee 40% knee 20% knee 0% 0 400 800 1200 1600 Sample runtime conditions (sorted on expectation error) Anomaly Error Threshold for Debugging Expectation Error Clustering • Knee-points mark clusters boundaries • Knee-point selection • Higher magnitude emphasizes large anomalies • Low magnitude captures multiple anomalies • Validation: we notice that knee points disappear when problems are resolved
Outline • Performance expectations for a wide-range of configuration settings • Determination of the anomaly error threshold • Decision-tree based anomaly depiction • Preliminary results • Discussion/ Conclusion
0 0 1 1 Decision Tree Based Anomaly Depictions White-box Usage for Debugging Black-box Usage for Avoidance • Decision trees correlate anomalies to problematic runtime conditions • Interpretable • Unlike Neural Nets, SVM, Perceptrons • No prior knowledge • Unlike Bayesian trees [COH-OSDI04] • Versatile a a b b Anomaly 80% prob. b Normal 70% prob. Anomaly 90% prob. c c c c Hints If a=0: anomaly If a=1,b=0: normal If a=1,b=1: anomaly Anomaly a=0, b=1, c=2,…. Normal Prefer shorter, easily interpreted trees Prefer longer, more precise tree
Design Recap • We wish to depict performance anomalies across a wide-range of system configurations and workload conditions • Derive performance expectations via a hierarchy of sub-models • Search for anomalous runtime conditions with carefully selected anomaly error threshold • Use decision trees to extrapolate a comprehensive anomaly depiction
Outline • Performance expectations for a wide-range of configuration settings • Determination of the anomaly error threshold • Decision-tree based anomaly depiction • Preliminary results • Discussion/ Conclusion
Depiction Assisted Debugging Depiction of a real performance anomaly. • System: JBoss • 8 runtime conditions (including app type) • 4 machine cluster, 2.66 GHz CPU • Found and fixed 3 performance anomalies • One is shown in detail below Misunderstood J2EE configuration which manifests when multiple components are placed on node 2
Discovered Anomalies • Misunderstood J2EE configuration caused remote invocations to unintentionally execute locally • A mishandled out-of-memory error under high concurrency caused the Tomcat 5.0 servlet container to drop requests • Circular dependency in the component invocation sequences caused connection timeouts under certain component placement strategies
Outline • Performance expectations for a wide-range of configuration settings • Determination of the anomaly error threshold • Decision-tree based anomaly depiction • Preliminary results • Discussion/ Conclusion
Discussion • Limitations • Cannot detect non-deterministic anomalies • Is it model inaccuracy or a performance anomaly? • Requires manual investigation, but model is much less complex than the system • Debugging is still a manual process • Future work • Short term: Investigate more system configurations • Short term: Depict anomalies in more systems • Long term: More systematic depiction-assisted debugging methods
Take Away • Comprehensive depictions of performance anomalies on a wide-range of runtime conditions can aid debugging and avoidance • We have designed and implemented an approach to: • Model a wide-range of system configurations • Determine anomalous conditions • Depict the anomalies in an easy-to-interpret fashion • We have already used our approach to find 3 performance bugs