Download
1 / 20
200 likes | 333 Views
Low Frequency conditions in January-2003. due to. violation of IEGC permitted frequency band. The following figures relate to 15-minute time blocks under the ABT regime when the average frequency of.

E N D
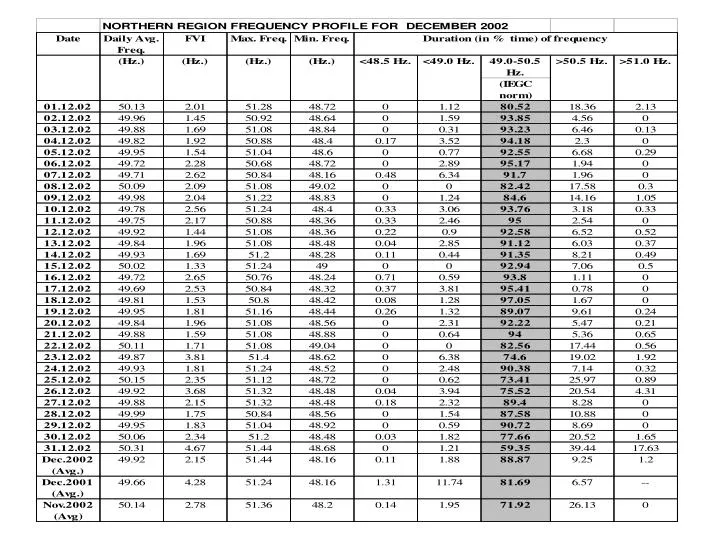
Low Frequency conditions in January-2003 due to violation of IEGC permitted frequency band The following figures relate to 15-minute time blocks under the ABT regime when the average frequency of the time block has been 49.0 Hz or below.. The total percentage of these low frequency blocks in January- 2003 has been 14.01 %. Percentage of time Average of MWh Average state contributed Maximum Violation index overdrawal overdrawal State/UT to this frequency overdrawal (ideal value 0) below 49.0 (MW) violation (MW) Hz A B C D=SQRT(BC)*A/100 J & K 16540 96 166 234 189 Haryana 12153 68 171 386 176 Delhi 8580 64 128 278 121 HP 5071 86 57 102 65 UT Chandigarh 5392 94 55 77 61 Uttaranchal 3122 74 40 83 43 UP 3264 35 89 146 40 Rajasthan 1258 20 60 89 15 Punjab 477 9 53 75 5 The above figures are based on the data obtained from Special Energy Meters (SEMs) installed in Northern Region.
Low Frequency Conditions in February 2003 due to violation of IEGC permitted frequency band The following figures relate to 15-minute time blocks under the ABT regime when the average frequency of the time block has been 49.0 Hz or below.. The total percentage of these low frequency blocks in February-2003 has been 2.9 %. The above figures are based on the data obtained from Special Energy Meters (SEMs) installed in Northern Region
High Frequency Conditions in February 2003 due to violation of IEGC permitted frequency band The following figures relate to 15-minute time blocks under the ABT regime when the average frequency of the time block has been 50.5 Hz or above. The total percentage of these low frequency blocks in February-2003 has been 8.93 %. The above figures are based on the data obtained from Special Energy Meters (SEMs) installed in Northern Region