Download
1 / 77
770 likes | 1k Views
Cardiovascular Physiology. 14. About this Chapter. Anatomical Review of the heart Cardiac muscle and the heart Cardiac muscle cell contraction Cardiac muscle cell action potential Conduction system and EKG The heart as a pump Mechanical Events of cardiac cycle Cardiac Cycle

E N D
About this Chapter • Anatomical Review of the heart • Cardiac muscle and the heart • Cardiac muscle cell contraction • Cardiac muscle cell action potential • Conduction system and EKG • The heart as a pump • Mechanical Events of cardiac cycle • Cardiac Cycle • Wigger’s diagram
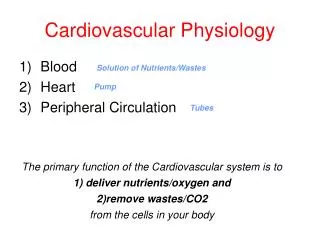
Location and Orientation of the heart The heart is the size of your fist and weighs less than a pound. It began beating 22 days after conception and continues to rhythmically contract until the times dies. It is located in the thoracic cavity posterior to the ribs and just superior to the diaphragm. It is position so the apex points to the left and anterior to the rest of the heart. The base faces posteriorly.
Structure of the Heart The heart is composed mostly of myocardium Figure 14-7e–f
Structure of the Heart The heart valves ensure one-way flow Figure 14-7g
Heart Valves PLAY Animation: Cardiovascular System: Anatomy Review: The Heart Figure 14-9
Cardiac Muscle versus Skeletal Muscle • Smaller and have single nucleus per fiber • Have intercalated disks • Desmosomes allow force to be transferred • Gap Junctions provide electrical connection • T-tubules are larger and branch • Sarcoplasmic reticulum is smaller • Mitochondria occupy one-third of cell volume
Anatomy: Cardiac Muscle Tissue 1% of myocardial cells are designed to spontaneously generate an action potential. They can contract without outside signal= autorhythmic. Pacemaker cells do not have sarcomeres Figure 14-10
Histology of Myocardium • Involuntary muscle • Striated, has sarcomeres • Many mitochondria • Uni- or binucleated • Branched • Intercalated Disc • Rhythmic contractions • Does not fatigue as easily as skeletal • Does not have individual neuromuscular junctions • Independent contractions • Require high O2
Excitation-contraction coupling and relaxation in cardiac muscle 1 Action potential enters from adjacent cell. Ca2+ ECF 1 2 Voltage-gated Ca2+ channels open. Ca2+ enters cell. ICF Ryanodine receptor-channel 3 Ca2+ induces Ca2+ release through ryanodine receptor-channels (RyR). 2 3 SR Sarcoplasmic reticulum (SR) Ca2+ T-tubule Figure 14-11, steps 1–3
Excitation-contraction coupling and relaxation in cardiac muscle 1 Action potential enters from adjacent cell. Ca2+ ECF 1 2 Voltage-gated Ca2+ channels open. Ca2+ enters cell. ICF Ryanodine receptor-channel 3 Ca2+ induces Ca2+ release through ryanodine receptor-channels (RyR). 2 3 SR Sarcoplasmic reticulum (SR) 4 Local release causes Ca2+ spark. Ca2+ T-tubule 5 Summed Ca2+ Sparks create a Ca2+ signal. 4 Ca2+ spark 5 Ca2+ signal Figure 14-11, steps 1–5
Excitation-contraction coupling and relaxation in cardiac muscle 1 Action potential enters from adjacent cell. Ca2+ ECF 1 2 Voltage-gated Ca2+ channels open. Ca2+ enters cell. ICF Ryanodine receptor-channel 3 Ca2+ induces Ca2+ release through ryanodine receptor-channels (RyR). 2 3 SR Sarcoplasmic reticulum (SR) 4 Local release causes Ca2+ spark. Ca2+ T-tubule 5 Summed Ca2+ Sparks create a Ca2+ signal. 4 Ca2+ spark Ca2+ ions bind to troponin to initiate contraction. 6 5 Ca2+ signal 6 Contraction Figure 14-11, steps 1–6
Excitation-contraction coupling and relaxation in cardiac muscle 1 Action potential enters from adjacent cell. Ca2+ ECF 1 2 Voltage-gated Ca2+ channels open. Ca2+ enters cell. ICF Ryanodine receptor-channel 3 Ca2+ induces Ca2+ release through ryanodine receptor-channels (RyR). 2 3 SR Sarcoplasmic reticulum (SR) Ca2+ stores 4 Local release causes Ca2+ spark. Ca2+ T-tubule 5 Summed Ca2+ Sparks create a Ca2+ signal. 4 ATP Ca2+ spark Ca2+ 8 Ca2+ ions bind to troponin to initiate contraction. 6 5 7 Relaxation occurs when Ca2+ unbinds from troponin. Ca2+ signal Ca2+ 8 Ca2+ is pumped back into the sarcoplasmic reticulum for storage. 7 6 Actin Myosin Relaxation Contraction Figure 14-11, steps 1–8
Excitation-contraction coupling and relaxation in cardiac muscle 9 10 1 Action potential enters from adjacent cell. Ca2+ Ca2+ 3 Na+ 2 K+ ECF 1 ATP 2 Voltage-gated Ca2+ channels open. Ca2+ enters cell. ICF 3 Na+ Ryanodine receptor-channel Ca2+ 3 Ca2+ induces Ca2+ release through ryanodine receptor-channels (RyR). 2 3 SR Sarcoplasmic reticulum (SR) Ca2+ stores 4 Local release causes Ca2+ spark. Ca2+ T-tubule 5 Summed Ca2+ Sparks create a Ca2+ signal. 4 ATP Ca2+ spark Ca2+ 8 Ca2+ ions bind to troponin to initiate contraction. 6 5 7 Relaxation occurs when Ca2+ unbinds from troponin. Ca2+ signal Ca2+ 8 Ca2+ is pumped back into the sarcoplasmic reticulum for storage. 7 6 Actin 9 Ca2+ is exchanged with Na+. 10 Na+ gradient is maintained by the Na+-K+-ATPase. Myosin Relaxation Contraction Figure 14-11, steps 1–10
Myocardial Contractile Cells PX = Permeability to ion X PNa 1 +20 2 PK and PCa 0 -20 PK and PCa 3 0 -40 Membrane potential (mV) PNa -60 -80 4 4 -100 0 100 200 300 Time (msec) Phase Membrane channels 0 Na+ channels open 1 Na+ channels close 2 Ca2+ channels open; fast K+ channels close 3 Ca2+ channels close; slow K+ channels open 4 Resting potential Action potential of a cardiac contractile cell Resting membrane potential is -90mv. Na+ passes through double gated voltage channels Plateau results from decreased K+ and increased Ca++ Plateau end when flux is reversed Figure 14-13
Myocardial Contractile Cells Refractory periods and summation in skeletal and cardiac muscle- this prevents summation as it happens in skeletal muscle Figure 14-14c
Action Potentials in Cardiac Autorhythmic Cells The membrane potential of pace maker cells is -60mv (pace maker potential)but it drifts to threshold because of If channels. Treshold is reached because If channels (allow current to flow) are permeable to both K+ and Na+. PLAY Animation: Cardiovascular System: Cardiac Action Potential Figure 14-15
Modulation of Heart Rate by the Nervous System Sympathetic stimulation targets If channels to open rapidly. Parasympathetic stimuation targets K+ and Ca++ channels, it hyper-polarizes the cell and slows depolarization Figure 14-16
Electrical Conduction in Myocardial Cells Figure 14-17
Electrical Conduction in Heart 1 1 SA node AV node 2 1 THE CONDUCTING SYSTEM OF THE HEART SA node depolarizes. 2 Electrical activity goes rapidly to AV node via internodal pathways. SA node 3 Internodal pathways 3 Depolarization spreads more slowly across atria. Conduction slows through AV node. AV node 4 Depolarization moves rapidly through ventricular conducting system to the apex of the heart. A-V bundle 4 Bundle branches Purkinje fibers Depolarization wave spreads upward from the apex. 5 5 Purple shading in steps 2–5 represents depolarization. Figure 14-18
Electrical Conduction in Heart 1 1 SA node AV node 1 THE CONDUCTING SYSTEM OF THE HEART SA node depolarizes. SA node Internodal pathways AV node A-V bundle Bundle branches Purkinje fibers Purple shading in steps 2–5 represents depolarization. Figure 14-18, step 1
Electrical Conduction in Heart 1 1 SA node AV node 2 1 THE CONDUCTING SYSTEM OF THE HEART SA node depolarizes. 2 Electrical activity goes rapidly to AV node via internodal pathways. SA node Internodal pathways AV node A-V bundle Bundle branches Purkinje fibers Purple shading in steps 2–5 represents depolarization. Figure 14-18, steps 1–2
Electrical Conduction in Heart 1 1 SA node AV node 2 1 THE CONDUCTING SYSTEM OF THE HEART SA node depolarizes. 2 Electrical activity goes rapidly to AV node via internodal pathways. SA node 3 Internodal pathways 3 Depolarization spreads more slowly across atria. Conduction slows through AV node. AV node A-V bundle Bundle branches Purkinje fibers Purple shading in steps 2–5 represents depolarization. Figure 14-18, steps 1–3
Electrical Conduction in Heart 1 1 SA node AV node 2 1 THE CONDUCTING SYSTEM OF THE HEART SA node depolarizes. 2 Electrical activity goes rapidly to AV node via internodal pathways. SA node 3 Internodal pathways 3 Depolarization spreads more slowly across atria. Conduction slows through AV node. AV node Depolarization moves rapidly through ventricular conducting system to the apex of the heart. 4 A-V bundle 4 Bundle branches Purkinje fibers Purple shading in steps 2–5 represents depolarization. Figure 14-18, steps 1–4
Electrical Conduction in Heart 1 1 SA node AV node 2 1 THE CONDUCTING SYSTEM OF THE HEART SA node depolarizes. 2 Electrical activity goes rapidly to AV node via internodal pathways. SA node 3 Internodal pathways 3 Depolarization spreads more slowly across atria. Conduction slows through AV node. AV node 4 Depolarization moves rapidly through ventricular conducting system to the apex of the heart. A-V bundle 4 Bundle branches Purkinje fibers Depolarization wave spreads upward from the apex. 5 5 Purple shading in steps 2–5 represents depolarization. Figure 14-18, steps 1–5
Electrical Conduction • AV node • Direction of electrical signals • Delay the transmission of action potentials • SA node • Set the pace of the heartbeat at 70 bpm • AV node (50 bpm) and Purkinje fibers (25-40 bpm) can act as pacemakers under some conditions
Einthoven’s Triangle Figure 14-19
The Electrocardiogram Three major waves: P wave, QRS complex, and T wave Waves correspond to events of the cardiac cycle Figure 14-20
Electrical Activity P wave: atrial depolarization START P The end R PQ or PR segment: conduction through AV node and A-V bundle T P P QS Atria contract. T wave: ventricular Repolarization ELECTRICAL EVENTS OF THE CARDIAC CYCLE Repolarization R T P QS Q wave P Q ST segment R R wave P R Q S P R Ventricles contract. Q P S wave QS Correlation between an ECG and electrical events in the heart Figure 14-21
Electrical Activity P wave: atrial depolarization START P ELECTRICAL EVENTS OF THE CARDIAC CYCLE Figure 14-21 (1 of 9)
Electrical Activity P wave: atrial depolarization START P PQ or PR segment: conduction through AV node and A-V bundle P Atria contract. ELECTRICAL EVENTS OF THE CARDIAC CYCLE Figure 14-21 (2 of 9)
Electrical Activity P wave: atrial depolarization START P PQ or PR segment: conduction through AV node and A-V bundle P Atria contract. ELECTRICAL EVENTS OF THE CARDIAC CYCLE Q wave P Q Figure 14-21 (3 of 9)
Electrical Activity P wave: atrial depolarization START P PQ or PR segment: conduction through AV node and A-V bundle P Atria contract. ELECTRICAL EVENTS OF THE CARDIAC CYCLE Q wave P Q R wave R P Q Figure 14-21 (4 of 9)
Electrical Activity P wave: atrial depolarization START P PQ or PR segment: conduction through AV node and A-V bundle P Atria contract. ELECTRICAL EVENTS OF THE CARDIAC CYCLE Q wave P Q R wave R P R Q P S wave QS Figure 14-21 (5 of 9)
Electrical Activity P wave: atrial depolarization START P PQ or PR segment: conduction through AV node and A-V bundle P Atria contract. ELECTRICAL EVENTS OF THE CARDIAC CYCLE Q wave P Q ST segment R R wave P R Q S P R Ventricles contract. Q P S wave QS Figure 14-21 (6 of 9)
Electrical Activity P wave: atrial depolarization START P PQ or PR segment: conduction through AV node and A-V bundle P Atria contract. T wave: ventricular Repolarization ELECTRICAL EVENTS OF THE CARDIAC CYCLE Repolarization R T P QS Q wave P Q ST segment R R wave P R Q S P R Ventricles contract. Q P S wave QS Figure 14-21 (7 of 9)
Electrical Activity P wave: atrial depolarization START P The end R PQ or PR segment: conduction through AV node and A-V bundle T P P QS Atria contract. T wave: ventricular Repolarization ELECTRICAL EVENTS OF THE CARDIAC CYCLE Repolarization R T P QS Q wave P Q ST segment R R wave P R Q S P R Ventricles contract. Q P S wave QS Figure 14-21 (8 of 9)
Electrical Activity P wave: atrial depolarization START P The end R PQ or PR segment: conduction through AV node and A-V bundle T P P QS Atria contract. T wave: ventricular Repolarization ELECTRICAL EVENTS OF THE CARDIAC CYCLE Repolarization R T P QS Q wave P Q ST segment R R wave P R Q S P R Ventricles contract. Q P S wave QS Figure 14-21 (9 of 9)
Electrical Activity Comparison of an ECG and a myocardial action potential Figure 14-22
Electrical Activity Normal and abnormal electrocardiograms Figure 14-23
Mechanical Events Late diastole: both sets of chambers are relaxed and ventricles fill passively. 1 START Isovolumic ventricular relaxation: as ventricles relax, pressure in ventricles falls, blood flows back into cups of semilunar valves and snaps them closed. 5 Atrial systole: atrial contraction forces a small amount of additional blood into ventricles. 2 Isovolumic ventricular contraction: first phase of ventricular contraction pushes AV valves closed but does not create enough pressure to open semilunar valves. 3 Ventricular ejection: as ventricular pressure rises and exceeds pressure in the arteries, the semilunar valves open and blood is ejected. 4 Mechanical events of the cardiac cycle PLAY Animation: Cardiovascular System: Cardiac Cycle Figure 14-24
Mechanical Events Late diastole: both sets of chambers are relaxed and ventricles fill passively. 1 START Figure 14-24, step 1
Mechanical Events Late diastole: both sets of chambers are relaxed and ventricles fill passively. 1 START Atrial systole: atrial contraction forces a small amount of additional blood into ventricles. 2 Figure 14-24, steps 1–2
Mechanical Events Late diastole: both sets of chambers are relaxed and ventricles fill passively. 1 START Atrial systole: atrial contraction forces a small amount of additional blood into ventricles. 2 Isovolumic ventricular contraction: first phase of ventricular contraction pushes AV valves closed but does not create enough pressure to open semilunar valves. 3 Figure 14-24, steps 1–3
Mechanical Events Late diastole: both sets of chambers are relaxed and ventricles fill passively. 1 START Atrial systole: atrial contraction forces a small amount of additional blood into ventricles. 2 Isovolumic ventricular contraction: first phase of ventricular contraction pushes AV valves closed but does not create enough pressure to open semilunar valves. 3 Ventricular ejection: as ventricular pressure rises and exceeds pressure in the arteries, the semilunar valves open and blood is ejected. 4 Figure 14-24, steps 1–4
Mechanical Events Late diastole: both sets of chambers are relaxed and ventricles fill passively. 1 START Isovolumic ventricular relaxation: as ventricles relax, pressure in ventricles falls, blood flows back into cups of semilunar valves and snaps them closed. 5 Atrial systole: atrial contraction forces a small amount of additional blood into ventricles. 2 Isovolumic ventricular contraction: first phase of ventricular contraction pushes AV valves closed but does not create enough pressure to open semilunar valves. 3 Ventricular ejection: as ventricular pressure rises and exceeds pressure in the arteries, the semilunar valves open and blood is ejected. 4 Figure 14-24, steps 1–5
Cardiac Cycle KEY EDV = End-diastolic volume ESV = End-systolic volume Stroke volume 120 D ESV 80 C One cardiac cycle Left ventricular pressure (mm Hg) 40 EDV B A 0 65 100 135 Left ventricular volume (mL) Left ventricular pressure-volume changes during one cardiac cycle Figure 14-25