Download
1 / 10
100 likes | 239 Views
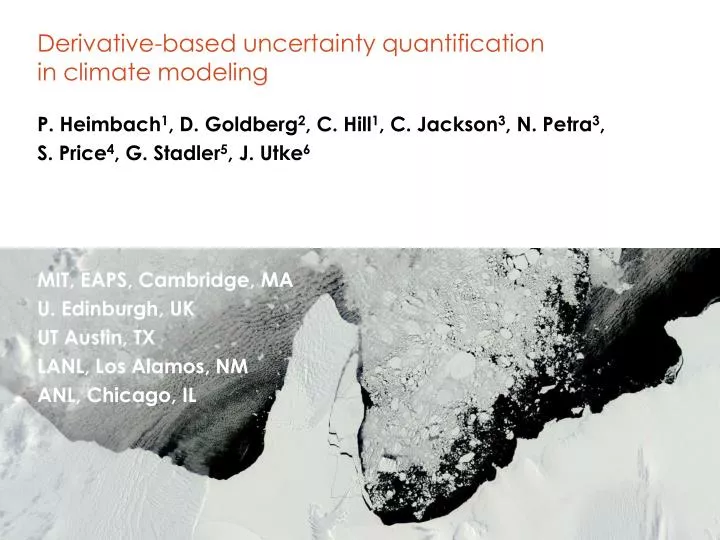
Derivative-based uncertainty quantification in climate modeling. P. Heimbach 1 , D. Goldberg 2 , C. Hill 1 , C. Jackson 3 , N. Petra 3 , S. Price 4 , G. Stadler 5 , J. Utke 6 MIT, EAPS, Cambridge, MA U. Edinburgh, UK UT Austin, TX LANL, Los Alamos, NM ANL, Chicago, IL.

E N D
Derivative-based uncertainty quantification in climate modeling P. Heimbach1, D. Goldberg2, C. Hill1, C. Jackson3, N. Petra3, S. Price4, G. Stadler5, J. Utke6 MIT, EAPS, Cambridge, MA U. Edinburgh, UK UT Austin, TX LANL, Los Alamos, NM ANL, Chicago, IL
Example of science questions • Past, present, future contribution of mass loss from polar ice sheets to global mean sea level rise • Rate of present-day heat uptake by the ocean • The ocean’s role in the global carbon cycle
Posing the “UQ” problem • For each of the examples given, how are estimates affected by … • …observation uncertainty? • …observation sampling? • …prior information on input parameters? • …model uncertainties, including artificial drift? • Need a framework that: • accounts for these uncertainties • takes optimal advantage of information content in models and observations • is computationally tractable and relevant
The uncertainty space is very high-dimensional • 3D fields of: • initial conditions • spatially varying model parameters, e.g.: • vertical or eddy-induced mixing (ocean) • material properties of ice(Arrhenius param.) • 2D fields of surface or basal boundary conditions, e.g.: • surface forcing (heat flux, precipitation) • basal sliding, geothermal fluxes, basal melt rates • bed topography/bathymetry • air-sea gas (CO2) exhange & transfer coefficients Underlying most of these questions: how well constrained by observations?
Deterministic, gradient-based approaches • sensitivity analysis • use adjoint to infer sensitivity of climate indices (e.g., ocean heat content; MOC; ice sheet volume; total carbon uptake; …)to input fields • optimal state & parameter estimation • optimal state/reconstruction of climate state from sparse, heterogeneous observations • optimal & “drift-free” initial conditions for prediction • inverse/predictive uncertainty propagation
Example: Sensitivity of carbon uptake to changes in vertical diffusivity • MIT general circulation model (MITgcm) coupled to biogeochemical module • Adjoint model generated via open-source algorithmic/automatic differentiation tool OpenAD (Argonne National Lab) C. Hill, O. Jahn, et al., in prep.
Example: Marine ice sheet/shelf adjointsensitivities Goldberg & Heimbach (2013) • Adjoint model also gives linear sensitivities • Sensitivities of Grounded Volume of marine ice sheet highlight role of ice shelf margins Sensitivity to m Sensitivity to warming (softening)
Example: ice sheet model inversion & initialization Perego, Price, Stadler (2014) • UQ-enabled predictions for sea level rise require initial conditions for large ice masses that are consistent with: • surface flow velocities • present day ice geometry • accumulation data or output from Earth system models • Compute MAP estimates for the basal friction coefficient field and the bedrock topography (each has about 33,000 parameters) • Overall 5500 adjoint-based gradients required: 11,000 (non)linear PDE solves Left: Implied accumulation rate without taking into account Earth system model data; Middle: implied accumulation rate after taking into account Earth system model data, which is shown on the Right. • Forward problem has 350,000 parameters, implementation based on LiveV FEM package and Trilinos solvers
Small curvature Large uncertainty Large curvature Small uncertainty controls x M observations y Inverse uncertainty propagation – Hessian method Data uncertainty Controls uncertainty Δy Δx Model–data misfit function: Solution / posterior uncertainty? curvature of misfit function Described by Hessian matrix of J Nonlinear term Linear term Posterior covariance of controls x ≈ Inverse of Hessian matrix R
Data uncertainty Controls uncertainty Target uncertainty PyyPxx UQ algorithm for Ocean State estimation • Assimilation of observations uncertainty • Reduction of prior controls uncertainty • Forward uncertainty propagation UQ scheme