Download
1 / 15
150 likes | 232 Views
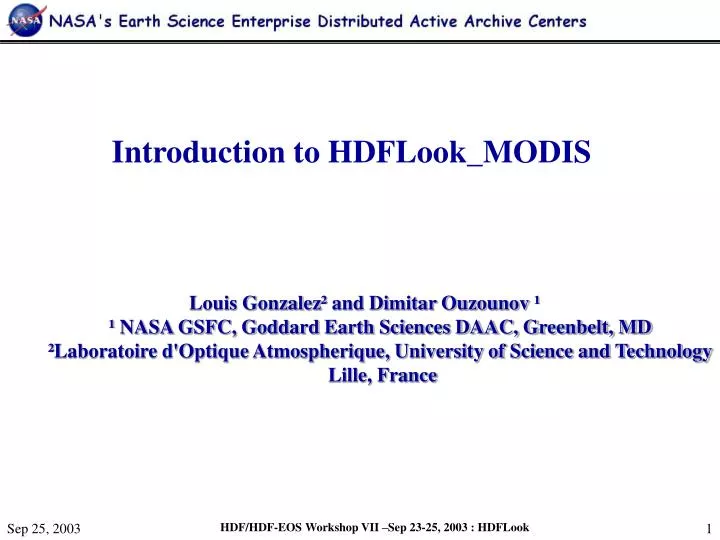
Introduction to HDFLook_MODIS. Louis Gonzalez² and Dimitar Ouzounov ¹ ¹ NASA GSFC, Goddard Earth Sciences DAAC, Greenbelt, MD ²Laboratoire d'Optique Atmospherique, University of Science and Technology Lille, France. MSPHINX/HDFLook philosophy.

E N D
Introduction to HDFLook_MODIS • Louis Gonzalez² and Dimitar Ouzounov ¹ • ¹ NASA GSFC, Goddard Earth Sciences DAAC, Greenbelt, MD • ²Laboratoire d'Optique Atmospherique, University of Science and Technology • Lille, France
MSPHINX/HDFLook philosophy In 2002-2003, together GES DAAC and LOA- UL, France distributed more than 3000 copies of the new HDFLook_MODIS around the world.
What is HDFLook • What is HDFLook - Is a X-Motif based reader and viewer of NCSA HDF v.4.x and HDF-EOS 2.x science datasets • HDFLook-MODIS is a result of joint collaboration between LOA USTL, France, and GES DAAC • Main HDFLook developers are Louis Gonzalez and Christine Deroo, Laboratoire d'Optique Atmosphérique, USTL, France • Main HDFLook science and data support: D.Ouzounov, S.Ahmad, J.Li (GES DAAC), E.Vermote (University of Maryland / MODLAND) , N.Saleous and R.Wolfe (LTP/GSFC )
HDFLook_MODIS Overview HDFLook-MODIS is a result of joint collaboration between LOA USTL, France, and GES DAAC and is based on the very popular MSPHINX(Motif satellite Process Handling Images uNder XWindows) tool philosophy (http://www-loa.univ-lille1.fr/Msphinx/Msphinx_gb.html). Created as a flexible modular tool, is easy to update, add new features, and is free to users obtaining it from the GES DAAC HDF-EOS Visualization – MODIS:L1B, Land L2,L3; Atmospheric L2, L3,L4; Ocean L2,L3,L4 mapped,Ocean L3, L4; Mapping and projections -Geo-projection conversion utility.L2, L3, and L4 products. LINEAR.GOODE’S,MOLLWEIDE,HAMMER, AZIMUTHAL, LAMBERT, MILLER, MOLLWEIDE, ORTHOGRAPHIC, SINUSOIDAL, VAN DER GRINTEN,WAGNER 7, ISIN, POLDER Subsetting -Channel, Parameter, Spatial; Subsampling Multi granule processing -Mosaic and Stitch Data Conversion-HDF-EOS to ASCII, Binary, JPEG, GeoTIFF AERONET data bank accesses -Aerosol and other ancillary data is available from the ground based sun photometer measurements (AERONET data bank). Running modes - All current capabilities are available in interactive, operational and command line modes XWindows CE –SGI, HP, IBM-AIX, DEC, SUN, Linux, Macintosh and MS Windows (via Cygwin)
Mapping and projections Type of Mapping: Level1B RGB standard atmospheric corrected image or a single plane. Level1B RGB thermal anomalies corrected image . Level1B RGB thermal image. Mod09 RGB standard atmospheric corrected image or single plane. Other products (with latitude, longitude SDS records) a single plane. Other products (reprojected SDS records) a single plane.
Mapping and projections L2 and L3 Mapping L3 Ocean mapped 4KM DailyProduct (Mean) Calcite concentration day 25, 2001 Mapping Atmospheric Daily Global L3 gridded (1x1 degree grid mean) Cloud Top Temperature Water Vapor Near Infrared clear
AERONET data base Data type menu Select the data which you want to subset: Optical thickness Size distribution Refraction index Polarization All data
Multi granule processing -Mosaic and Stitch Interactive, operational and batch mode verbose clear_data set_home_directory /var/scratch set_tmp_directory /var/scratch set_map_directory /usr/modis/HDFLOOK/Maps set_output_directory /var/scratch/dimitar/test set_input_directory /ftp/datapool/OPS/user/MOGA/MYD021KM.003/2002.10.06 set_projection_to_geometry ProjectionTo="LINEAR" WidthTo=2000 HeightTo=1000 \ LatitudeMinTo=-90. LatitudeMaxTo=90.0 LongitudeMinTo=-180. LongitudeMaxTo=180.0 set_image_background color=White add_maps Coastlines=yes CoastlineColor=Green set_misc_options OnlyDay=Yes #set_image_RGB_composite THERMAL set_image_RGB_composite VISIBLE #add_grids color=Red LatitudeMin=-90 LatitudeMax=90 LatitudeStep=5 \ # LongitudeMin=-180 LongitudeMax=180 LongitudeStep=40 set_input_hdf_file /ftp/datapool/OPS/user/MOGA/MYD021KM.003/2002.10.06/MYD021KM*.hdf create_MODIS_RGB_Mosaic FileName="MYD021KM_day_aqua_2002.10.06" RGBMode="Log" CreateJPEG=yes MODIS/Aqua Day-time 5km Global RGB Browse 10.06.2002
The Global MODIS/Terra and Aqua Browse HDFLook The Global Browse 5 km pixel resolution image in the foreground (with polar regions omitted) was generated with MODIS/Terra daytime data over MODIS/Aqua daytime data using visible bands 1, 4 and 3. This is the first time the MODIS Data Support Team (MDST) has generated combined images with data from the Terra and Aqua satellites. The background image, also the first of its kind, was generated with MODIS/Terra nighttime data using infrared bands 31, 29 and 20. These images are generated with HDFLook from MODIS/Terra and MODIS/Aqua data that was acquired on September 16, 2002. Images courtesy of the MDST at the GES DAAC.
HDFLook on the fly Level1B visible and thermal anomalies over la Reunion
Night time Thermal composite These are thermal RGB images acquired during nightime 2002 141 (Brazil, Nile Delta) using these settings:band 31 Red 290K-275K, band 29 Green 280K-270K, band 20 B 300K-285K. the clouds which appear white (note the scale is reversed, the highest temperature is the lowest intensity and the lowest temperature is the highest intensity). The water appears very dark as the thermal inertia of water is so big that the warmest objects in the night data are the water bodies.[ Petitcolin F. and Vermote E. F. 2002]
Human activities Desert Mali (Along the river) Composite surface reflectance (MOD09) 250m
Operational use and system integration of HDFLook • It is a main programs to routinely generate Level 1B browse images (true-color for daytime, and brightness temperature for nighttime) for MODIS data from the Terra and Aqua satellites.(GES DAAC) • Spatial on-the-fly subsetting of MODIS Level 3 Ocean products from the Data Pool(GES DAAC) • On-demand parameter subsetting of MODIS Ocean Level 2 products(GES DAAC) • Operational Terra Modis preprocessing system (Yasuoka Lab, Institute of Industrial Science, University of Tokyo)
HDFLookSUMMARY • Accessing and visualization of all swath (level-1, and 2) and gridded (level-3 and 4) MODIS radiometric and geolocation, atmosphere, land, and ocean products, AIRS L1B and CERES data. • Re-mapping of swath data to world map • Reprojection from one projection to a different one • Interactive, operational and batch mode capabilities • Subsetting features - availability of parameter, band, and spatial subsetting • Multi-granule processing - Mosaic and stitch capabilities • Displays ancillary/data attributes • Data conversion- from scaled quantities to physical units • Format conversion- HDF-EOS to ASCII, Binary, JPEG, and Geo Tiff Where to get HDFLook :GES DAAC daac.gsfc.nasa.gov/MODIS/HDFlook LOA, UL, France www-loa.univ-lille1.fr/Hdflook/hdflook_gb.html This presentation described methods and tools implemented or planned for the Goddard DAAC that are intended to optimize access to MODIS data for the Earth Science community.