Download

1 / 32
320 likes | 397 Views
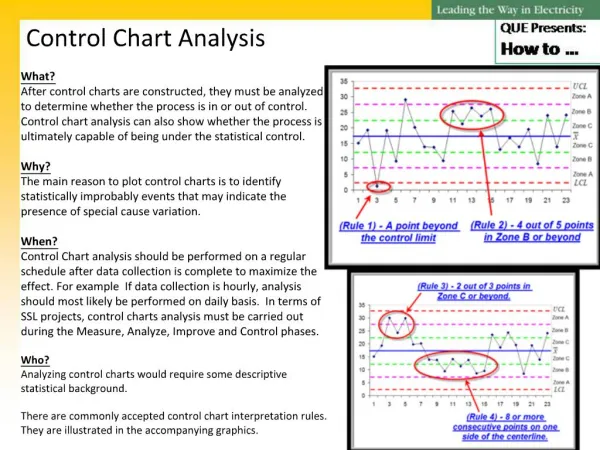
Historical Chart Analysis of Past Winners. By Steve Power. Analysis Techniques. Marketsmith Historical charts to look at former leaders IBD Rules to look for buy/sell points on these charts Buy points will be traditional bases

E N D
Historical Chart Analysis of Past Winners By Steve Power
Analysis Techniques Marketsmith Historical charts to look at former leaders IBD Rules to look for buy/sell points on these charts Buy points will be traditional bases Cup w/ handle, Cup, Flat Base, Double Bottom, Double Bottom with Handle, Ascending Base, High tight flag, etc. Add points will be 50 day MA, or 3 weeks tight
Analysis Techniques Sell Rules 7% Stop loss on all entries “Always, without Exception, Limit Losses to 7% or 8% of your cost” - How to Make Money in Stocks, p. 242 “ Low Volume and Other Weak Action” p. 268 “Breaking Support” p 269
Let’s get started Looking for a proper base or buy point
Stock to ReviewEBAY Chosen form O’Neil’s book, “How to Make Money in Stocks”
Would you buy this base? Assume this stock has all the fundamentals in CANSLIM, would you buy this stock?
Positives • Confirmed Uptrend • Uptrending RS • Resembles Cup with Handle Lets take a closer look • Negatives • V-shaped • 3 biggest down weeks are red, • Heavy Volume in Handle • 44% Deep • No tightness in base or handle Assume this stock has all the fundamentals in CANSLIM, would you buy this stock?
Result? Don’t Buy
Base Was Faulty Breakout from faulty base results in failure
Stock sets up again Positives Base is tightening up, action less wide and loose Base is not as deep Red weeks are drying up on right side, blue weeks are way above average, stock is under accumulation RS is rising to new highs 11 Up weeks on heavy volume Negatives 33% Deep (with 35% threshold) but still on the deeper side 3 red weeks on above average volume
Falls back into Base Note Mid- Week closes Why did it fail? Market was still in a bear, both failures coincide with new legs down
3rd Set Up is a 16 wk Double Bottom • A base this low in the pattern is acceptable in a bear market, especially given the RS • Red weeks are showing support action • Base is tighter, 21% deep • Tight closes in base • O’Neil Buy Point is out of this double bottom Continue Monitoring Stock Note Rising RS
What is the market doing this time? 4th day Follow Through, up 5.1% Breakout is occuring while market is 9 days into a successful follow through with only 3 distribution days, so you should be looking for buy candidates such as this
Daily Chart Stop Loss = 57.75(7%) • Volume Up 71% on Breakout day Buy Point = 62.09 Volume Up 71% on Breakout day FTD
After Breakout Drops about 2.5% below buy point, but never violates stop-loss
Post-Breakout Up only 13% from breakout after 11 weeks, not a rocket stock out of the gate, at first glance Rising RS tells story about condition of stock vs. the market New buy point off 50 day support, also a flat base, or base on base Also note flat base is part of a large cup with handle, also constructive action No reason to sell yet, hasn’t hit a 20-25% profit target, and it hasn’t hit any sell rules No selling
70.95 68 62.09 Clean breakout to new highs on 137% increase in volume
3 Tight Closes 2nd Pullback to 10 Week M.A. 2nd Pullback to 10 Week/50 day MA Note RS Line Racing to new highs • Volume Dry Up
Indexes Tell the Story 2 month downtrend Up 11%, Nasdaq down 16% FTD Stock is marching higher out of sound bases in spite of weak market action, hence rising RS line S&P500 actually made new lows If market turns to upside, stock could really take off Would you have held on? Stock never violated any key support levels or moving averages, never flashed a sell signal , could have held
New Bull Confirmed FTD FTD • Note
Stock Launches Once weight of market is removed, stock takes off
Buy Points on the Way Up • 1. Double Bottom • 2. 50 Day Pullback • 3 Flat Base • 4 50 Day Pullback • 5. 4 weeks tight 5 4 3 2 1
2nd pullback to 10 week/ 50 day MA, gets with 3% Stock is now up 65% from original breakout, and 50% from flat base, so add is more risky Rules state its okay to add though and volume looks acceptable on pullback
How to Make Money in Stocks Willam J. O’NeilPage 268-271 Take profits at 20-25% unless stock is up that much in <3wks New Highs on Low Volume Closing at or Near the Day’s Price Low 3rd or 4Th Stage bases Signs of a Poor Rally Great one day price drop Long Term Uptrend is broke Others are discussed in book as well
Possible Sell Points Exhaustion Gap/Reversal Support Breached Stock up 90% 25% gain from B/B First place to sell could have been at 20-25% profits 2nd Place to Sell could have been at heavy volume reversal and gap down, stock was up 90% from initial breakout, look for places to take some profits 3rd place may have been at break of 50MA(long term support) during uptrend 4th - Long term holders may wait for a 2nd stage base to form and sell down the road
If sold at 50 day MA breach 50 day MA breach around 104 Buypoint Double Bottom 62.09=68% 2. 50 day MA = 68.00 = 53% Flat Base = 70.85 = 46% 4. 50 day MA = 41% 5. 4 weeks tight = 13% 50 day MA = 7% The key is to have a selling plan long before its time to sell, so that when you sell rule occurs, you act on it and don’t think about it or hesitate.
Selling Varies by Personalities Some may decide to wait for a 2nd stage base to form is stock acts alright, and hold on for a longer gain. Stock only broke out of 1st stage 1st Year of new bull market after 2 year bear May have some room to run yet For longer term holds, Bill says sell when the stock lives below 10 week, or can’t rally above it for 8-9 weeks
Where did Ebay Go? 282% in 115 weeks Formed 2 more bases, before topping Again, up to preference to take profits during each run, and re-buy each base, or to hold through major corrections and base formations Decide in advance, and realize you are only afforded that decision if you pick a leader and you buy early in a bull market
How did EBAY Finally Top? Massive Gap Down 3rd stage base breakout with successful run, but weekly volume is not present during final advance Massive gap down on huge volume seals the deal, but stock is off 30% from its high when it finally gaps down Biggest Volume of Advance Weak Volume