Download
1 / 31
360 likes | 544 Views
GIS Error and Uncertainty. Longley et al., chs. 6 (and 15) Sources: Berry online text, Dawn Wright. Blinded by Science?. Result of “accurate” scientific measurement Reveal agenda, biases of their creators. GIS databases built from maps Not necessarily objective, scientific measurements

E N D
GIS Error and Uncertainty Longley et al., chs. 6 (and 15) Sources: Berry online text, Dawn Wright
Blinded by Science? • Result of “accurate” scientific measurement • Reveal agenda, biases of their creators • GIS databases built from maps Not necessarily objective, scientific measurements • Impossible to create perfect representation of world
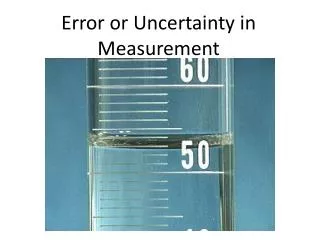
Uncertainty • Attribute uncertainty (Forest vs. Ag) • Positional uncertainty • Definitional uncertainty • Measurement uncertainty
The Necessity of “Fuzziness” • “It’s not easy to lie with maps, it’s essential...to present a useful and truthful picture, an accurate map must tell white lies.” -- Mark Monmonier • distort 3-D world into 2-D abstraction • characterize most important aspects of spatial reality • portray abstractions (e.g., gradients, contours) as distinct spatial objects
Fuzziness (cont.) • All GIS subject to uncertainty • What the data tell us about the real world • Range of possible “truths” • Uncertainty affects results of analysis • Confidence limits - “plus or minus” • Difficult to determine • “If it comes from a computer it must be right” • “If it has lots of decimal places, it must be accurate”
A conceptual view of uncertainty (U), Longley et al., chapter 6
Nick Chrisman’s View(www.wiley.com/college/chrisman/define.html )
Error induced by data cleaning, Longley et al., chapter 6, pages 132-133
Uncertainty • Measurements not perfectly accurate • Maps distorted to make them readable • Lines repositioned • Canal and Railroad • At this scale both objects thinner than map symbols • Map is generalized • Definitions vague, ambiguous, subjective • Landscape has changed over time
Assessing the Fuzziness • Positions assumed accurate • But really, just best guess • Differentiate best guesses from “truth” • “Shadow map of certainty” • where an estimate is likely to be the most accurate • Tracking error propagation
Search For Soil 2 & Forest 5How Good Given Uncertainty in Input Layers?
Spread boundary locations to a specified distance:Zone of transition, Cells on line are uncertain
Code cells according to distance from boundary, which relates to uncertainty
Based on distance from boundary, code cells with probability of correct classification
Same thing for Forest mapLinear Function of increasing probabilityCould also use inverse-distance-squared
Overlay soil & forest shadow maps to get joint probability map:Product of separate probabilities
Original overlay of S2/F5:Overlay implied 100% certaintyShadow map says differently!
Nearly HALF the map is fairly uncertainof the joint condition of S2/F5
Towards an “Honest GIS” • can map a simple feature location • can also map a continuum of certainty • model of the propagation of error (when maps are combined) • assessing error on continuous surfaces • verify performance of interpolation scheme
More Strategies • Simulation strategy • Complex models • Describing uncertainty as “a spatially autoregressive model with parameter rho” not helpful • How to get message across • Many models out there • Research on modeling uncertainty (NCGIA Intiative 1) • Users can’t understand them all
Strategies (cont.) • Producer of data must describe uncertainty • RMSE 7 m • Metadata • SDTS - 5 elements (+semantic) • Positional accuracy • Attribute accuracy • Logical consistency (logical rules? polygons close?) • Completeness • Lineage
Strategies (cont.) • Not effective • What impact will uncertainty have on results of analysis?? (1) Ignore the issue completely (2) Describe uncertainty with measures (shadow map or RMSE) (3) Simulate equally probable versions of data
Simulation Example:http://www.ncgia.ucsb.edu/~ashton/demos/propagate.html