Download
1 / 1
10 likes | 117 Views
Measured and Predicted UHECR Spectra. Upper Curve: E -2.35 Source Spectrum with source distribution that follows the z distribution of star formation rate, requires 10x energy input of lower curves and exhibits ‘pile-up effect’

E N D
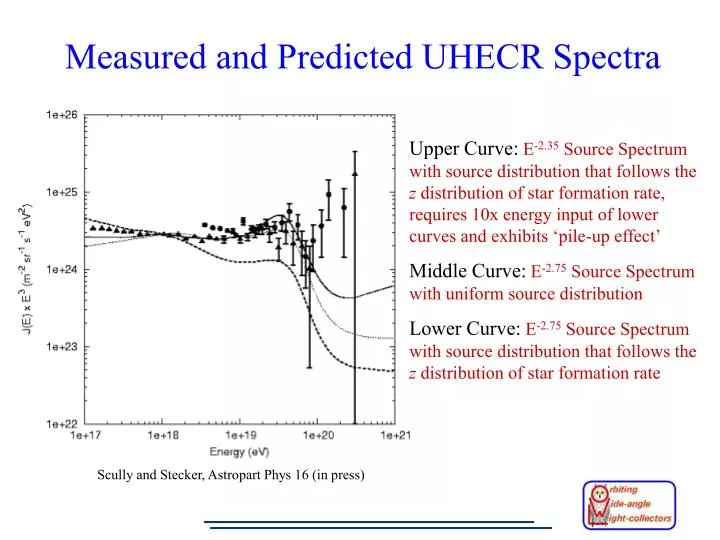
Measured and Predicted UHECR Spectra Upper Curve:E-2.35 Source Spectrum with source distribution that follows the z distribution of star formation rate, requires 10x energy input of lower curves and exhibits ‘pile-up effect’ Middle Curve:E-2.75 Source Spectrum with uniform source distribution Lower Curve:E-2.75 Source Spectrum with source distribution that follows the z distribution of star formation rate Scully and Stecker, Astropart Phys 16 (in press)