Download
1 / 18
180 likes | 272 Views
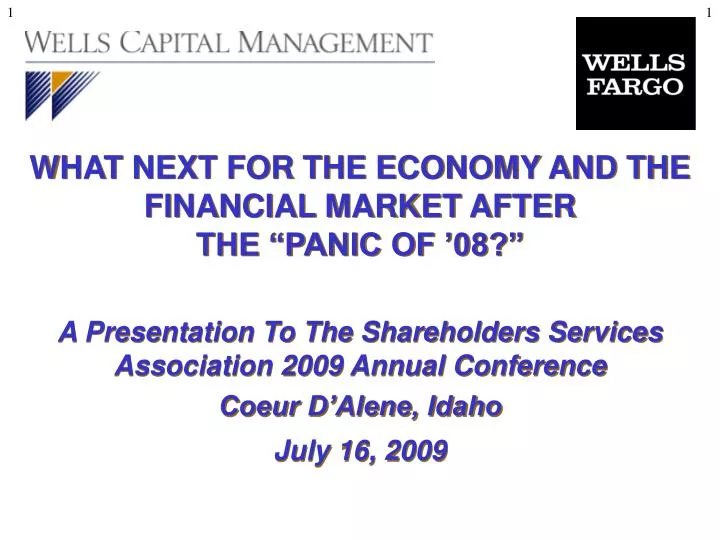
WHAT NEXT FOR THE ECONOMY AND THE FINANCIAL MARKET AFTER THE “PANIC OF ’08?” A Presentation To The Shareholders Services Association 2009 Annual Conference Coeur D’Alene, Idaho July 16, 2009. AN ECONOMIC RECOVERY IN THIS YEAR’S SECOND HALF…. * Lower Mortgage Rates, Increased Auto Output

E N D
WHAT NEXT FOR THE ECONOMY AND THE FINANCIAL MARKET AFTER THE “PANIC OF ’08?” A Presentation To The Shareholders Services Association 2009 Annual Conference Coeur D’Alene, Idaho July 16, 2009
AN ECONOMIC RECOVERY IN THIS YEAR’S SECOND HALF… * Lower Mortgage Rates, Increased Auto Output * Less Economic “Drag” From Home Construction, Inventory Declines * An Accelerated Credit “Thaw” * Aggressive Fiscal And Monetary Stimulus --An Eye To The Early And Mid-1930s
* A More Limited Boost From Lower Inflation, Interest Rates * Little “Pent-Up” Demand From Consumers * Fall-Out From The Credit “Freeze:” --A Foreclosure-Related Over-Hang Of Unsold Homes --Wealth Re-Building Via Increased Savings --Prolonged Lending Restraint From Unusually Severe Credit-Quality Problems …AND WHY IT WILL BE MODERATE
LABOR MARKET CONDITIONS OFTEN LAG THE ECONOMIC CYCLE Percent Thousands of Workers, 3-Mo. Moving Avgs. 400 10.5 6/09 9.5 200 8.5 Monthly Change, 0 Non-Farm Note: Bars Denote Payrolls 7.5 Recession Periods (Left Scale) -200 6.5 Unemployment Rate -400 (Right Scale) 5.5 -600 4.5 -800 3.5 Dec-89 Dec-92 Dec-95 Dec-98 Dec-01 Dec-04 Dec-07 Source: U.S. Labor Dep't, Bureau Of Labor
WHY INFLATION IS NOT A THREAT TO THE ECONOMY THIS YEAR * Unused Capacity At A Twenty-Six Year High * Weak “Pricing Power” * Federal Deficits Are “Counter-Cyclical” * The Federal Reserve Still “Pushing On A String”
HEIGHTENED COMPETITION, WEAK "PRICING POWER" KEEP A LID ON "CORE" INFLATION Year Ago Percent Change 25 14 20 12 CPI, Food & Energy 15 (Left Scale) 10 10 8 5 6 0 4 -5 2 CPI, Ex. Food & Energy -10 (Right Scale) 5/09 -15 0 Dec-72 Dec-77 Dec-82 Dec-87 Dec-92 Dec-97 Dec-02 Dec-07 Source: U.S. Dep't Of Labor
A "BEAR MARKET STEEPENING" OF THE TREASURY "YIELD CURVE" SINCE THE END OF 2008 The Treasury Yield Curve, Selected Periods; Yields In Percent 5.0 4.5 4.0 7/13/09 3.5 3.0 12/31/08 2.5 2.0 1.5 Fed Funds Target Rate (12/16/08)=0- 1.0 0.25% 0.5 0.0 0 5 10 15 20 25 30 35 40 Years To Maturity Source: Bloomberg Financial News, Inc.
STEADY-TO-LOWER NON-TREASURY YIELDS A SIGN THAT INFLATION EXPECTATIONS STILL CONTAINED Yield To Maturity, In Percentage Points 9.5 Investment-Grade Corporate Securities 8.5 7.5 6.5 5.5 7/10/09 Wk. 4.5 Agency Mortgage- Backed Securities 3.5 2.5 1.5 12/28/07 3/28/08 6/27/08 9/26/08 12/26/08 3/27/09 6/26/09 Source: Bank of America-Merrill Lynch, Inc.
9 A THREE-STAGE RISE IN U.S. INTEREST RATES: IT’S ALL ABOUT “EXPECTATIONS” * A Reflow Of “Flight” Capital Lifts Treasury Yields, Suppresses Non-Treasury Rates * Sizable Increase In Deficit Financing Directly, Indirectly Boosts Long-Term Treasury Yields * The Fed Hikes Short-Term Rates, Sells Securities To Drain “Liquidity,” As Private Credit Returns
INVESTOR INFLATION EXPECTATIONS SUBDUED BY CURRENT ECONOMIC WEAKNESS, DESPITE THE LONG-TERM INFLATION THREAT FROM MASSIVE POLICY STIMULUS The "Breakeven" Inflation Rate* On 10-Year Treasury Note, In Percent 2.8 2.4 2.0 Avg., 1/97- 1.6 12/08=2.1% 7/3/09=1.61% 1.2 0.8 0.4 0.0 Dec-02 Dec-03 Dec-04 Dec-05 Dec-06 Dec-07 Dec-08 Dec-09 *As measured by yield differences between conventional, 10-yr. Treasury notes and comparable "TIPS." Source: Bloomberg Financial News, Inc.
AN UNUSUALLY LARGE CASH "HOARD" A POTENTIAL SUPPORT FOR THE MARKET Percent Ratio, Money Fund Assets To The Wilshire 5000; Index: 1/6/96=100 53% 49% 45% 41% 37% 6/29/09 Wk.=38% 33% 29% Avg., 12/89- 25% 12/08=15% 21% 17% 13% 9% 1/5/96 1/9/98 1/14/00 1/18/02 1/23/04 1/27/06 2/1/08 2/5/10 Sources: Federal Reserve Board; Wilshire Associates, Inc.
S&P 500 VALUATION MODESTLY "CHEAP"... S&P 500 As A Multiple Of Forward 2-Year Consensus Operating Earnings Forecasts 27 23 Avg. P/E, 1983-2007=15.0 Times Forward Operating Earnings 19 15 11 7/14/09 P/E=13.9x 7 IBES Consensus Forward Earnings of $64.97/ Share 3 Jan-79 Jan-83 Jan-87 Jan-91 Jan-95 Jan-99 Jan-03 Jan-07 Sources: Standard & Poors, Inc., IBES, Federal Reserve Board
…PARTICULARLY COMPARED TO BONDS Ratio, Yield On Blended Corporate & 10-Year Treasury Note Vs. The S&P 500 Earnings Yield* 180 170 Stocks "Rich" Vs. Bonds 160 150 Avg., 1983- 140 07=108.0 130 120 110 100 90 80 Stocks "Cheap" Vs. Bonds 70 60 50 7/14/09, Based On IBES Consensus 40 Jan-79 Jan-83 Jan-87 Jan-91 Jan-95 Jan-99 Jan-03 Jan-07 Jan-11 Sources: Standard & Poors, Inc.; IBES; WCM Estimates
OPERATING LEVERAGE BACK TO A 45-YEAR HIGH Non-Fin'l Corps. Revenue Per Dollar Of Labor & Capital Costs 140% '09Q1 130% Avg., 1960- 2008=118% 120% 110% 100% 90% Mar-64 Mar-70 Mar-76 Mar-82 Mar-88 Mar-94 Mar-00 Mar-06 * Normalized revenue growth based on rolling, 5-year average annual gains. Source: U.S. Department Of Commerce
A TEMPORARY TILT FROM "HIGH BETA" TO "DEFENSIVE" STOCKS DURING THE MODERATE REOVERIES IN THE EARLY 1990S AND IN 2002-2003 Index: Ratio Of Tech & "Cyclicals" To "Defensive" Sector Price Indexes During The Last Two Economic Cycles:* Cyclical Low Points For The S&P 500=100 130 125 120 115 "Defensive" Stocks Out- 110 Perform " 105 100 95 90 0 20 40 60 80 100 120 140 160 Weeks From The S&P 500 Trough During The Last Two Economic Recoveries * 1991-93, 2001-04. "Cyclicals" include "big-ticket" consumer goods, materials producers and equipment makers; "defensive" sectors consist of consumer staples and health care. Sources: Standard & Poors, Inc; Bloomberg Financial News, Inc.
A NARROWER, BUT STILL UNUSUALLY LARGE RISK PREMIUM FOR BONDS OF AA-RATED, NON-FINANCIAL COMPANIES Option-Adjusted Yield Spreads To Comparable Treasury Issues; In Basis Points 300 250 AA-Rated Industrials (Ex. Telecomm & Transportation) 200 150 Average, 8/98- 12/07=67 B.P. 7/3/09 Wk.=120 100 B.P. 50 0 12/28/07 4/18/08 8/8/08 11/28/08 3/20/09 7/10/09 Note: Four-week moving average data. Source: Bank of America Merrill Lynch, Inc.
LONG-TERM "MUNIS" STILL "CHEAP" VS. TREASURY BONDS, DESPITE THE RECENT RALLY Pre-Tax Yield Ratio, Bond Buyer Index Of 20 Municipal GO Bonds Vs. 30-Yr. Treasury Bonds; In Percent 220% 192% 164% 136% Avg., 4/91-12/07=90.2% 7/9/09 Wk.=112% 108% 80% 12/27/01 2/20/03 4/15/04 6/9/05 8/3/06 9/27/07 11/20/08 1/14/10 Sources: The Bond Buyer; Bloomberg Financial News, Inc.
A PROFILE OF SELECTED "TRADITIONAL" AND "ALTERNATIVE" ASSETS Performance As Of June 2009 Risk- Annual Returns (In Percent) Adjusted 10-Yr, Returns, 10 S&P 500 Years* Correlation 1 Year 3 Years* 10 Years S&P 500 -26.2% -8.2% -2.2% -0.94 --- Commodities -45.8% -10.0% 4.3% 0.21 26.9% Gold 0.1% 14.6% 13.4% 2.06 -1.4% Hedge Funds -14.1% 1.3% 7.3% 1.25 15.3% Real Estate -46.8% -23.0% -1.3% -0.44 56.5% Foreign Currency -9.6% 2.0% 2.5% -0.34 22.8% Memo Item: Lehman Aggregate 6.1% 6.4% 6.0% 2.46 -4.5% Hi Yield Bonds -2.4% 2.1% 4.7% 0.26 61.0% Foreign (EAFE) Stocks (Local Currency) -28.5% -11.0% -1.4% -0.90 86.7% Emerging Market Stocks (Local Currency) -19.7% 4.4% 9.8% 0.24 77.4% Russell 2000 -25.0% -9.9% 2.4% -0.13 79.3% * Average annual returns; risk-adjusted returns measured by the Sharpe ratio. Sources: Factset Research, Inc., Standard & Poors, Inc.; MSCI