Download
1 / 6
60 likes | 142 Views
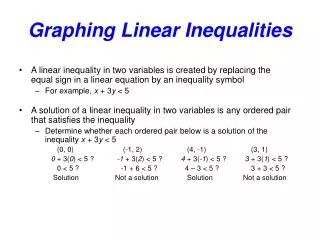
Graphing Inequalities. Unit 11, Day 1. How to Graph an Equation:. Start at the y-intercept on the y-axis Count “up and over” using the slope to create a second point (and a third, fourth, etc.) Connect the points and add arrows to create the line. y = -2x + 5. Graphing an Inequality.

E N D
Graphing Inequalities Unit 11, Day 1
How to Graph an Equation: • Start at the y-intercept on the y-axis • Count “up and over” using the slope to create a second point (and a third, fourth, etc.) • Connect the points and add arrows to create the line y = -2x + 5
Graphing an Inequality • Graphing an inequality is the same as graphing an equation, with 2 little extra steps at the end: • Decide if the line is dashed or solid • Dashed for < and > • Solid for and • Decide in which direction to shade • Test the point (0,0) into the inequality
How to Graph an Equation: • Plot the points using slope and y-intercept. • Is this a dashed line or a solid line? • Test the point (0,0). y < -2x + 5 True or False?
Video Example: Graphing Inequalities