Download
1 / 17
170 likes | 293 Views
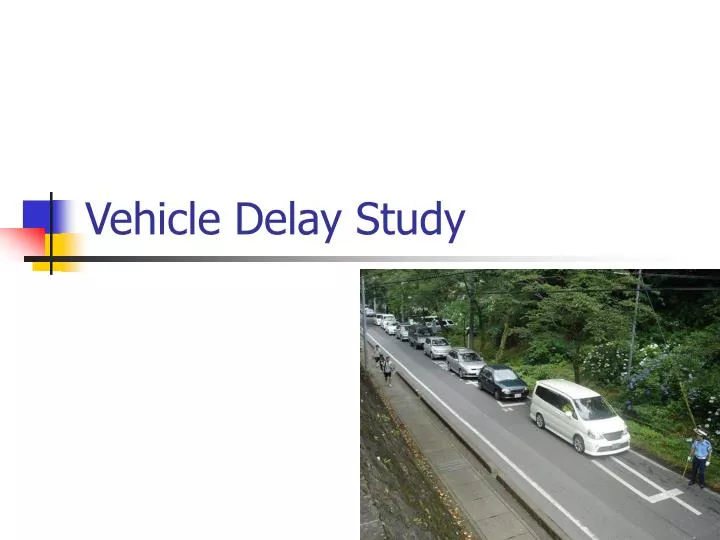
Vehicle Delay Study. Before anything else. Read the manual carefully. It is your homework What is covered in the following slides is just general. General. Determines LOS of lane group/approach Measured by seconds delayed for eachvehicle! Simplification of Highway Capacity Manual HCM.

E N D
Before anything else • Read the manual carefully. It is your homework • What is covered in the following slides is just general
General • Determines LOS of lane group/approach • Measured by seconds delayed for eachvehicle! • Simplification of Highway Capacity Manual HCM
Collect the data • Choose intersection • Signalized intersections • Choose time of day • Usually peak hour • Choose the approach • You may need to zoom in further to a specific lane group • Exclusive left turn is studied by itself
Collect the data • For illustrations let us study delay of an exclusive left turn lane
Collect the data • First observer counts and records the number of vehicles stopped on the left lane for each 15 seconds interval • A vehicle is counted more than once in the delay determination if it is stopped during more than one sampling time.
Collect the data • The second observer performs a separate tabulation of the lane volume for one minute intervals by classifying the vehicles as either stopped or not stopping. • At least 350 cars must be counted
Data Analysis • Two calculations are needed • General calculations • For sake of LOS determination
Data Analysis • General calculations
Data Analysis • General calculations
Data Analysis • For sake of LOS determination • Correction factors: • acceleration deceleration • Vehicles processed in less that 15 sec • All of that is accounted and used in the simplified way:
LOS • Compare that number to the following table
Calculations • repeat this analysis for the other approaches of the intersection • Prepare a graphical representation for the delay and LOS of each lane group
Interpret and conclude • Answer questions in manual • Prepare your presentation