Download
1 / 1
10 likes | 257 Views
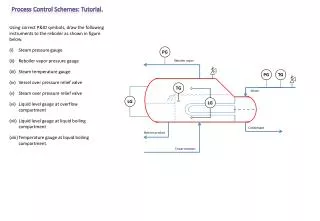
Diamond-anvil cell [DAC] cylinder with heater and gasket. In Talc stability In 10-Å phase stability We need to see this jump. Pressure-Temperature Stability Studies of Talc and 10- Å phase using x-ray diffraction.

E N D
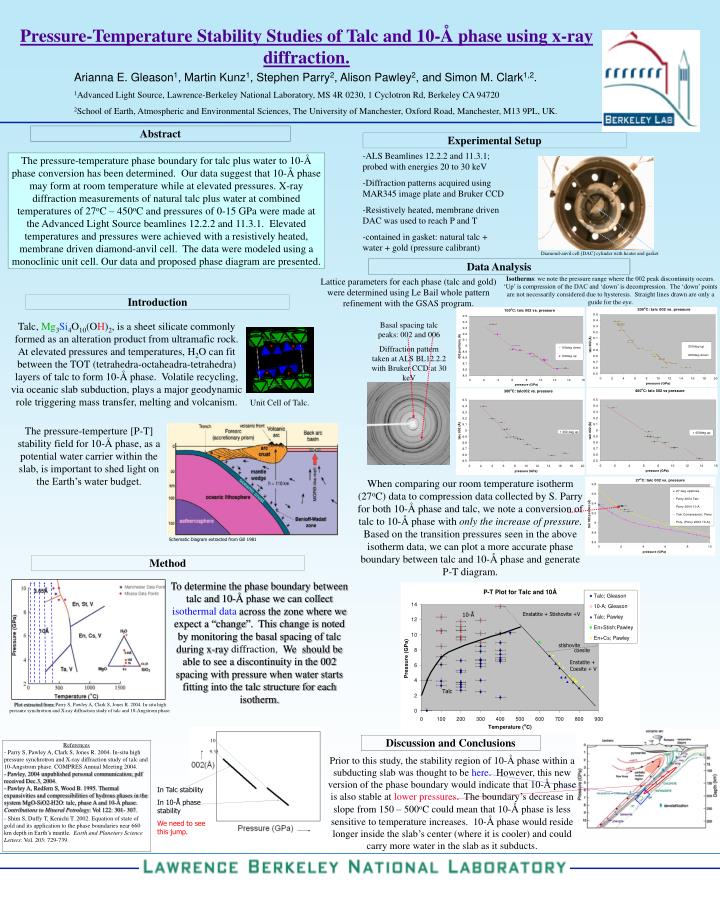
Diamond-anvil cell [DAC] cylinder with heater and gasket In Talc stability In 10-Å phase stability We need to see this jump. Pressure-Temperature Stability Studies of Talc and 10-Å phase using x-ray diffraction. Arianna E. Gleason1, Martin Kunz1, Stephen Parry2, Alison Pawley2, and Simon M. Clark1,2. 1Advanced Light Source, Lawrence-Berkeley National Laboratory, MS 4R 0230, 1 Cyclotron Rd, Berkeley CA 94720 2School of Earth, Atmospheric and Environmental Sciences, The University of Manchester, Oxford Road, Manchester, M13 9PL, UK. Abstract Experimental Setup -ALS Beamlines 12.2.2 and 11.3.1; probed with energies 20 to 30 keV -Diffraction patterns acquired using MAR345 image plate and Bruker CCD -Resistively heated, membrane driven DAC was used to reach P and T -contained in gasket: natural talc + water + gold (pressure calibrant) The pressure-temperature phase boundary for talc plus water to 10-Å phase conversion has been determined. Our data suggest that 10-Å phase may form at room temperature while at elevated pressures. X-ray diffraction measurements of natural talc plus water at combined temperatures of 27oC – 450oC and pressures of 0-15 GPa were made at the Advanced Light Source beamlines 12.2.2 and 11.3.1. Elevated temperatures and pressures were achieved with a resistively heated, membrane driven diamond-anvil cell. The data were modeled using a monoclinic unit cell. Our data and proposed phase diagram are presented. Data Analysis Isotherms: we note the pressure range where the 002 peak discontinuity occurs. ‘Up’ is compression of the DAC and ‘down’ is decompression. The ‘down’ points are not necessarily considered due to hysteresis. Straight lines drawn are only a guide for the eye. Lattice parameters for each phase (talc and gold) were determined using Le Bail whole pattern refinement with the GSAS program. Introduction Talc, Mg3Si4O10(OH)2, is a sheet silicate commonly formed as an alteration product from ultramafic rock. At elevated pressures and temperatures, H2O can fit between the TOT (tetrahedra-octaheadra-tetrahedra) layers of talc to form 10-Å phase. Volatile recycling, via oceanic slab subduction, plays a major geodynamic role triggering mass transfer, melting and volcanism. Basal spacing talc peaks: 002 and 006 Diffraction pattern taken at ALS BL12.2.2 with Bruker CCD at 30 keV Unit Cell of Talc. The pressure-temperture [P-T] stability field for 10-Å phase, as a potential water carrier within the slab, is important to shed light on the Earth’s water budget. When comparing our room temperature isotherm (27oC) data to compression data collected by S. Parry for both 10-Å phase and talc, we note a conversion of talc to 10-Å phase with only the increase of pressure. Based on the transition pressures seen in the above isotherm data, we can plot a more accurate phase boundary between talc and 10-Å phase and generate P-T diagram. Schematic Diagram extracted from Gill 1981 Method To determine the phase boundary between talc and 10-Å phase we can collect isothermal data across the zone where we expect a “change”. This change is noted by monitoring the basal spacing of talc during x-ray diffraction. We should be able to see a discontinuity in the 002 spacing with pressure when water starts fitting into the talc structure for each isotherm. Plot extracted from: Parry S, Pawley A, Clark S, Jones R. 2004. In-situ high pressure synchrotron and X-ray diffraction study of talc and 10-Angstrom phase. Discussion and Conclusions 10 References - Parry S, Pawley A, Clark S, Jones R. 2004. In-situ high pressure synchrotron and X-ray diffraction study of talc and 10-Angstrom phase. COMPRES Annual Meeting 2004. - Pawley, 2004 unpublished personal communication; pdf received Dec.3, 2004. - Pawley A, Redfern S, Wood B. 1995. Thermal expansivities and compressibilities of hydrous phases in the system MgO-SiO2-H2O: talc, phase A and 10-Å phase. Contributions to Mineral Petrology: Vol 122: 301- 307. - Shim S, Duffy T, Kenichi T. 2002. Equation of state of gold and its application to the phase boundaries near 660 km depth in Earth’s mantle. Earth and Planetary Science Letters: Vol. 203: 729-739. 9.35 Prior to this study, the stability region of 10-Å phase within a subducting slab was thought to be here. However, this new version of the phase boundary would indicate that 10-Å phase is also stable at lower pressures. The boundary’s decrease in slope from 150 – 500oC could mean that 10-Å phase is less sensitive to temperature increases. 10-Å phase would reside longer inside the slab’s center (where it is cooler) and could carry more water in the slab as it subducts. Extracted from Poli and Schmidt 2002