Download
1 / 2
20 likes | 193 Views
Feminisation rate. Population pyramid. Characteristics of the centres. Distribution of the different jobs. Employment in the equestrian centres. In 1999, 1 130 questionnaires have been sent to a sample of equestrian centres and 325 (29%) were returned and analysed.

E N D
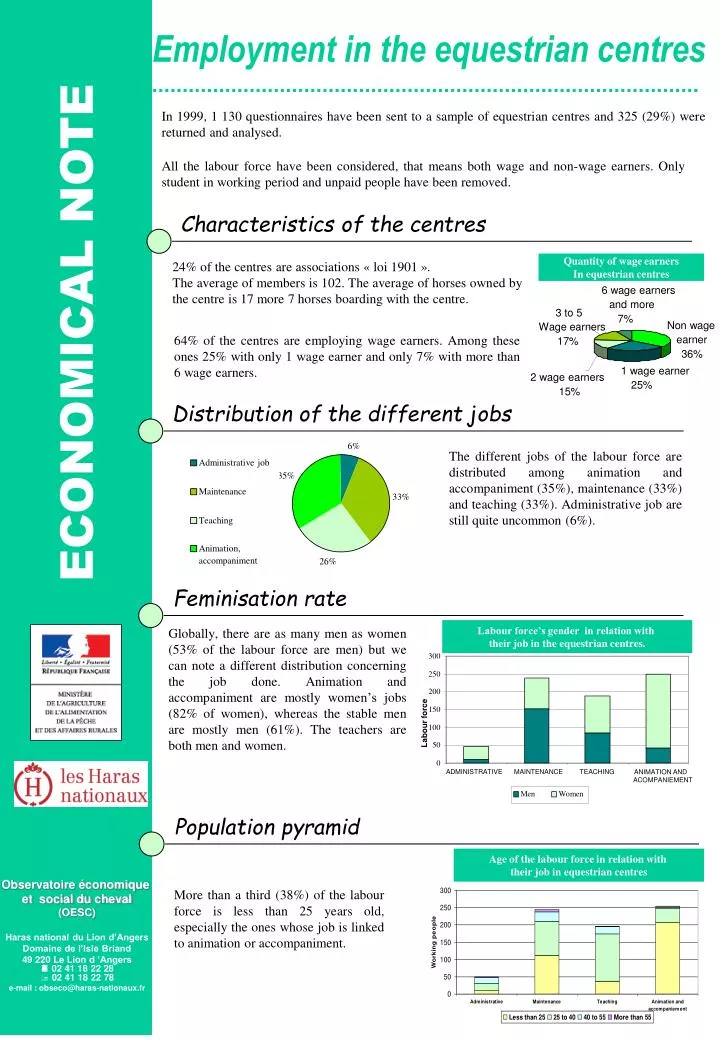
Feminisation rate Population pyramid Characteristics of the centres Distribution of the different jobs Employment in the equestrian centres In 1999, 1 130 questionnaires have been sent to a sample of equestrian centres and 325 (29%) were returned and analysed. All the labour force have been considered, that means both wage and non-wage earners. Only student in working period and unpaid people have been removed. 24% of the centres are associations « loi 1901 ». The average of members is 102. The average of horses owned by the centre is 17 more 7 horses boarding with the centre. Quantity of wage earners In equestrian centres ECONOMICAL NOTE 6 wage earners and more 3 to 5 7% Non wage Wage earners 64% of the centres are employing wage earners. Among these ones 25% with only 1 wage earner and only 7% with more than 6 wage earners. earner 17% 36% 1 wage earner 2 wage earners 25% 15% 6% The different jobs of the labour force are distributed among animation and accompaniment (35%), maintenance (33%) and teaching (33%). Administrative job are still quite uncommon (6%). Administrative job 35% Maintenance 33% Teaching Animation, accompaniment 26% Globally, there are as many men as women (53% of the labour force are men) but we can note a different distribution concerning the job done. Animation and accompaniment are mostly women’s jobs (82% of women), whereas the stable men are mostly men (61%). The teachers are both men and women. Labour force’s gender in relation with their job in the equestrian centres. 300 250 200 150 Labour force 100 50 0 ADMINISTRATIVE MAINTENANCE TEACHING ANIMATION AND ACOMPANIEMENT Men Women Observatoire économique et social du cheval (OESC) Haras national du Lion d’Angers Domaine de l’Isle Briand 49 220 Le Lion d ’Angers 02 41 18 22 28 02 41 18 22 78 e-mail : obseco@haras-nationaux.fr Age of the labour force in relation with their job in equestrian centres More than a third (38%) of the labour force is less than 25 years old, especially the ones whose job is linked to animation or accompaniment.
Services proposed by the centres Synthesis of employment in equestrian centres in 2001 Work contracts Turnover 55% of the work contracts are fixed-term contracts and 67% are full-time job contracts. In France, the average rate of fixed-term contracts is 10% and full-time jobs represent 77% of the contracts. (source : INSEE, 1999). Equestrian centres usually use apprenticeship contracts and social contracts. Indeed, these kind of contracts represent 49% of the fixed-term contracts in equestrian centres compared to 34% at a national level. (source : INSEE, 1999) Distribution of the different fixed-term contracts (N=506, negatives answers have been ruled out) Distribution of part-time job contracts (N=242, negatives answers have been ruled out) 40% of the centres have others activities (breeding, horse business…). We can differentiate the centres by the fact to give or not give riding lessons. 70% are doing it whereas 30% don’t. Finally, 9% of the centres have a seasonal activity. Characteristics of the centres who don’t propose riding lessons. Characteristics of the centres who Propose riding lessons -are employing less labour force (1,7 employees:0,7 wage and 1 non-wage earner). -the members are more turn towards « tourism », - have another activity -are employing more labour force (4 employees : 3,1 wage et 0,9 non-wage earners, -represent more than 85% of the labour force and more than 91% of the wage earners. -the members are more turned towards sport and competition on horses and ponies We can note a relation between the quantity of members and the quantity of employees in the equestrian centres. 100 riders are generating 3,5 jobs. Distribution of the centres in relation with their turnover ( x 1000 €) 40% of the equestrian centres have a turnover between 15 244 and 91 469 euros. 12% have less than 7 622 euros and 10% more than 152 449 euros. Among the centres giving riding lessons, 12% have a turn over lower than 15 244 euros. The ones which don’t give riding lessons are 47% in this situation. No More than answer 152,5 18% 91,5 to 10% Less than 152,5 7,6 10% 12% 45,7 to 7,6 to 91,5 15,2 to 15,2 18% 45,7 10% 22% France : 4 260 centres Per centre 12 350 jobs 8 520 wage earners 2,9 jobs 2 wage earners 3,5 workmen for 100 riders Fiche réalisée par : Les Haras nationaux - Direction du développement - Observatoire économique et social du cheval (OESC) -- Octobre 2002 Pour en savoir plus, s’adresser à l’OESC : 02 41 18 22 28. 02 41 18 22 78 . e-mail : obseco@haras-nationaux.fr