Download
1 / 6

E N D
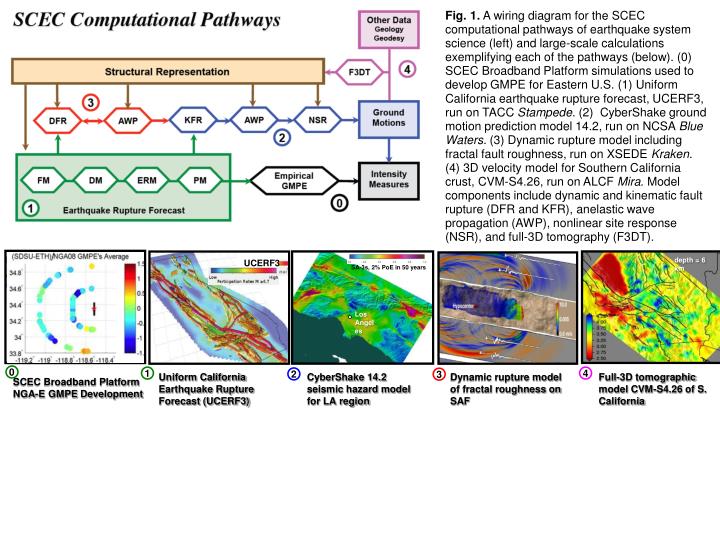
Fig. 1. A wiring diagram for the SCEC computational pathways of earthquake system science (left) and large-scale calculations exemplifying each of the pathways (below). (0) SCEC Broadband Platform simulations used to develop GMPE for Eastern U.S. (1) Uniform California earthquake rupture forecast, UCERF3, run on TACC Stampede. (2) CyberShake ground motion prediction model 14.2, run on NCSA Blue Waters. (3) Dynamic rupture model including fractal fault roughness, run on XSEDE Kraken. (4) 3D velocity model for Southern California crust, CVM-S4.26, run on ALCF Mira. Model components include dynamic and kinematic fault rupture (DFR and KFR), anelastic wave propagation (AWP), nonlinear site response (NSR), and full-3D tomography (F3DT). depth = 6 km UCERF3 SA-3s, 2% PoE in 50 years Los Angeles 0 1 Uniform California Earthquake Rupture Forecast (UCERF3) CyberShake 14.2 seismic hazard model for LA region Dynamic rupture model of fractal roughness on SAF 4 Full-3D tomographic model CVM-S4.26 of S. California 2 3 SCEC Broadband Platform NGA-E GMPE Development
BBP-1D CVM-S4.26 1 2 2 3 4 Figure 2. Comparison of two seismic hazard models for the Los Angeles region from CyberShake Study 14.2, completed in early March, 2014. The left panel is based on an average 1D model, and the right panel is based on the F3DT-refined structure CVM-S4.26. The 3D model shows important amplitude differences from the 1D model, several of which are annotated on the right panel: (1) lower near-fault intensities due to 3D scattering; (2) much higher intensities in near-fault basins due to directivity-basin coupling; (3) higher intensities in the Los Angeles basins; and (4) lower intensities in hard-rock areas. The maps are computed for 3-s response spectra at an exceedance probability of 2% in 50 years. Both models include all fault ruptures in the Uniform California Earthquake Rupture Forecast, version 2 (UCERF2), and each comprises about 240 million seismograms.
Figure 3. Left: Scaling of SCEC HPC Applications. Weak scaling of AWP-ODC (sustained TFLOPS) on XK7, XE6 and HPS250. Right: Strong scaling of Hercules (wall clock time) on Kraken, Blue Waters and Mira. AWP-ODC is measured with 2.3 PFLOPS on XK7, and 653 TFLOPS on XE6. Benchmarks are based on variety of problem sizes.
Figure 4: CyberShake workflow. Circles indicate computational modules and rectangles indicate files and databases. We have automated these processing stages using Pegasus-WMS software to ensure the processes with data dependencies run in the required order. Workflow tools also increase the robustness of our calculations by providing error detection and restart capabilities that enable us to restart a partially completed workflow from an intermediate place in the processing, rather than from the beginning.
Figure 3. (Left) AWP-ODC-GPU Weak scaling and sustained performance using AWP in single precision. Solid (dashed) black line is (ideal) speedup on Titan, round/triangle/cross points are Flops performance on Titan/Blue Waters/Keeneland. A perfect linear speedup is observed between 16 and 8,192 nodes. A sustained 2.3 Pflop/s performance was recorded on 16,384 Titan nodes; (right): SORD performance on OLCF
Figure 4: Hercules scalability curves based on measured performance on ALCF Blue Gene/Q (Mira), NSF Track 1 (Blue Waters) and XSEDE Track 2 (Kraken) systems. Benchmarking on Mira for this allocation was only completed for the strong scaling curve from 8K to 32K cores (using 32 processes per node). These initial results, though limited, indicate that Hercules will sustain the excellent scalability shown in other machines, for which the computational readiness of the code is well established.