Download
1 / 36
700 likes | 1.31k Views
Alternative Investments Portfolio Management. Why Alternative Investments?. Think in terms of return and risk objectives Equities: low return environment 2000s: Two major stock market crashes Lost decade for US blue-chip (worst since the 1930’s) Changing demographics + low interest rates

E N D
Why Alternative Investments? Think in terms of return and risk objectives • Equities: low return environment • 2000s: • Two major stock market crashes • Lost decade for US blue-chip (worst since the 1930’s) • Changing demographics + low interest rates • Higher pension liabilities *Use alternative investments for return enhancement
Why Alternative Investments? • Globalization • International stock markets more highly correlated • Less able to diversify risk • Equities in the past decade: uneven risk contribution • Liability and inflation hedging • Timing and amount of pension payments • Liability matching • Protection of real purchasing power • Many DB plans have built-in inflation indexation *Use alternative investments for risk reduction and risk management
Assets/liabilities matching • Profit seeking portfolio • Earn the returns to meet liabilities • Liability hedging portfolio • Manage risk of liabilities such as interest rate and inflation Liabilities Assets
Why Alternative Investments? • Can think of alternative investments in two different frameworks • Traditional asset allocation - think of alternatives as an asset class
Why Alternative Investments? • Core-satellite investing • Core is indexed, and may include different asset classes • Satellites are actively managed • Where alternative investments fit in
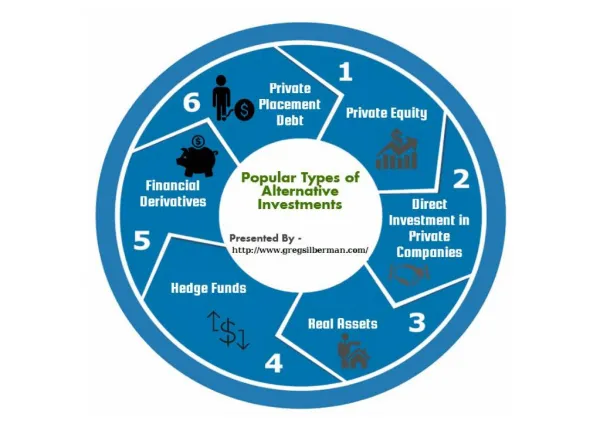
Types of Alternative Investments • Traditional alternative investments • Real estate • Private equity ENTR6910 • Commodities • Modern alternative investments • Hedge funds • Managed futures FINE6800 • Distressed equities typically classified as a hedge fund strategy (or private equity) • Infrastructure (classified as real estate in text, but is treated as a separate category in the industry now)
Common Features of Alternative Investments • Relatively illiquid • Lock-up periods • Hedge funds: 3 months to 2 years • Private equity funds: 5-7 years • Infrastructure funds: 4-10 years (can be longer) • Unlike stocks and bonds, no centralized marketplace for trading • Hedge funds secondary market: www.hedgebay.com • Commands a corresponding liquidity premium
Common Features of Alternative Investments • High due diligence costs due to complex investment structures, specific expertise, and lack of reporting transparency • Difficulty appraising performance • Which benchmark to use • Valuation of illiquid assets – often no market price
Real Estate Two ways to invest in real estate: • Direct investment in residences, business real estate and land • Indirect investment • Companies engaged in development, ownership or management e.g., homebuilders, real estate operating companies (REOCs) • Real estate investment trusts (REITs) – public equities representing pooled investments
Real Estate • Commingled/pooled real estate funds (CREFs) – professionally managed vehicles for substantial pooled accounts • Open ended: fund will invest as new money is raised (may have specific entry points); typically have a 4-year lock-up period • Closed ended: Cannot get into the fund once it’s closed, and have a longer lock-up period (e.g., 10 years)
Real Estate Funds • Use of leverage: 40% - 60% common in many funds • Fees: ~ 1.0 to 1.5% • Target returns • Long term bonds + x% • CPI + x%
Real Estate Benchmarks • National Council of Real Estate Investment Fiduciaries (NCREIF) Property Index for direct investments • Value-weighted commercial properties • Quarterly returns • Appraisal method leads to stale valuations and appearance of smoother performance • NAREIT Index for indirect investments • Real-time value-weighted index of all REITs traded on NYSE, going back to 1972 • A levered index (because REITs use leverage). Hence, higher standard deviation than NCREIF (www.reit.com) • For other indices, see text
The Role of Real Estate in a Portfolio • Low correlation with stocks and bonds • Income enhancements through rentals • For the period 1990-2004, REITs have a higher Sharpe ratio than the S&P500, but it is lower than the Lehman Aggregate Bond Index (now Barclays Capital) • Improve diversification relative to stocks and bonds but may be redundant to portfolios also containing hedge funds and commodities • Mixed results from studies of inflation hedging ability • Summary of empirical studies on p.491
Infrastructure • Private investments in infrastructure projects or contracts • Risk varies by categories
Infrastructure • Can be done through direct or indirect investments • Big pension plans such as CPPIB, Teachers’ and OMERS have direct investments • Teachers’ and OMERS: UK’s High Speed One • Smaller pension plans do it through a limited partnership (LP) with an infrastructure fund manager • Some infrastructure funds are publicly listed as an income trust • ETFs – index of infrastructure management companies that are publicly traded • iShares Global Infrastructure ETF (listed on the TSX)
Infrastructure • Infrastructure Funds • Target returns: 10% - 18% annualized over the lock-up period • Some of the major players: • Macquarie (has been around in this field the longest) • JP Morgan • Morgan Stanley • UBS • Goldman Sachs • GE + Credit Suisse
Infrastructure Funds • Most have minimum allocation of $10-25 million • May have as few as 8-10 projects (concentrated risk) • Use of leverage: 40% - 60% common, higher for social infrastructure (because of higher credit quality) • Fees: • Management fees - before 1.5% - 2% , now 1% - 1.5% • Carried interest – before 15% - 20% if return > 8% (industry standard), now Goldman Sachs and Macquarie have lowered their carry to 10%
Infrastructure Funds • Illiquid assets – timeline different from equities • When starting up a fund, have to raise capital • Large capital commitment per asset • Half of the portfolio can remain uninvested after two years • MER is charged on uninvested commitments, e.g., 0.75% per annum versus 1.5% on invested commitments • Supposed to discourage manager from rushing into investments he/she may regret
Infrastructure • Reporting • Quarterly in house valuation • Macquarie - DCF model (30-40 years) • JP Morgan - DCF model (25 years) • Plus EV/EBITDA multiple analysis of similar assets (as a confirmation of DCF valuation) • Audited once a year • Governance • Funds may have an independent Board of Directors, but may also include the LPs on the board • May hold an investment for 3 to 7 years
Characteristics of Infrastructure Assets • Quasi-monopolistic and regulated • The high initial capital outlays act as a barrier to entry. As a result, infrastructure assets have quasi-monopolistic characteristics • Because of this and the “public good” nature of infrastructure assets, their transition to the private sector has been accompanied by a high degree of regulation and government oversight • The utility industry is a prime example of an infrastructure asset that has been privatized but remains highly regulated
Characteristics of Infrastructure Assets • Demand • Relatively inelastic and have few substitutes • Stable cash flow • For the two reasons above • Enables high leverage ratios • Long-lived assets • Suits pension and endowment funds, foundations…etc. • Asset life > 50 years • Infrastructure privatization deals are also long-term, lasting anywhere from 30 to 99 years
Characteristics of Infrastructure Assets • Inflation hedge • Many leases on infrastructure assets are CPI-linked • Hybrid asset • Elements of real estate, fixed income, and private equity: • Mature, government-regulated utility is analogous to fixed income • Developing infrastructure assets in India is analogous to opportunistic real estate development • Airports are common in private equity investments (buying the operating companies and improving them)
Commodities Components of the S&P/Goldman Sachs Commodity Index: * Traded on the London Metal Exchange (LME), others are based on U.S. trading (CME)
Commodities • Direct investments • Cash purchase of physical commodities • Requires possession, storage, financing, insurance and transportation of commodities • Indirect investments • Exposure to markets via derivatives (e.g., long positions in futures contracts) • Equity in commodity producers • TSX Global Gold index • May not effectively provide full exposure to commodity price movements, because traditionally, companies hedge their exposure (changing in the late 2000’s to become unhedged)
TSX Weights by Market CapAs of September 10, 2012 Source: S&P Indices
Commodity Benchmarks • Indices based on futures prices • Examples: S&P GSCI, DJ-UBSCI • Replicate returns to holding long positions in listed futures contracts (nearby contracts: shortest time to maturity, to reflect spot prices) • Can vary widely in composition, weighting scheme and purpose • Market weighting difficult • GSCI uses world production levels (in dollars) as weights • Hence, energy has the biggest weight (67%)
Components of Commodity Return • Spot/price return • Changes in nearby futures prices • Commodities often have positive exposure to event risk (e.g., supply shocks – a prime determinant of price) • Collateral return/yield • Futures are bought on margin. Yield earned if margin (typically 10%) is invested in Treasuries during the life of the futures contract • Roll return/yield • Change in futures prices not attributable to the change in spot prices, but from rolling over of futures contracts
Components of Commodity Return • Roll yield • If futures curve is in contango: • Negatively sloped futures curve (near-term futures contracts trade at a discount to those settling in the future) • Reflects storage costs of non-perishable commodities • Results in a negative roll yield, because have to pay a higher price for the next contract when the current one matures • Results in the commodity fund losing money even in stable markets
Role of Commodities in the Portfolio • Risk diversifier • Long term returns may be lower than stocks and bonds • But low correlations with U.S. as well as globe stocks and bonds • Inflation hedge • Diversification benefits strongest during periods of unexpected changes in inflation