Download
1 / 53
0 likes | 6 Views
Explore the comprehensive Q3 FY2023 Logistics Review Report for February 2023, providing key insights and trends in the logistics industry.

E N D
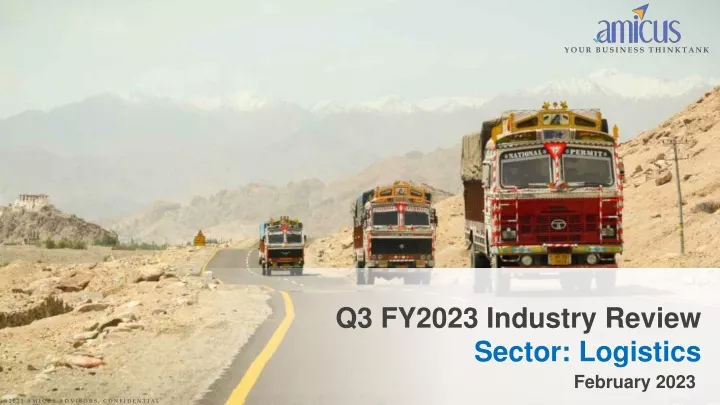
YOUR BUSINESS THINKTANK Q3 FY2023 Industry Review Sector: Logistics February 2023 @ 2 0 2 3 A M I C U S A D V I S O R S , C O N F I D E N T I A L
About the Report YOUR BUSINESS THINKTANK • This report is the second in a series of quarterly reports focused on the logistics sector. • The current report for Third Quarter Fiscal Year 2023 (Q3, FY2023), provides insights into the financial performance of the leading twelve listed companies in the logistics industry. The segment mix including Express Service providers, rail/ road transportation companies, contract logistics players, Multimodal container and CFS/ICD operators and Ports • Amicus team has compiled the financial and and other relevant information from company filings, industry reports, and other public sources. We have presented the data to identify trends, patterns, and insights that can help investors, analysts, and other stakeholders in the logistics industry. • Macroeconomic trends and numbers have been compiled from appropriate source data. • In all cases, we have considered the Consolidated results of the companies under review @ 2 0 2 3 A M I C U S A D V I S O R S , C O N F I D E N T I A L
Buoyant about India YOUR BUSINESS THINKTANK India will be big export economy It's Not India's Decade, It's India's Century I'm very bullish on India Bob Sternfels •Global McKinsey Head, Sep 2022 Sundar Pichai •CEO, Google, Feb 2023 Tim Cook •CEO, Apple, Feb 2023 @ 2 0 2 3 A M I C U S A D V I S O R S , C O N F I D E N T I A L
YOUR BUSINESS THINKTANK Macroeconomics & Industry Highlights
India Growth Story YOUR BUSINESS THINKTANK India’s GDP Quarter Wise (Pre to Post COVID) 20.1% 13.5% 8.4% 6.3% 5.4% 5.0% 4.7% 4.5% 4.1% 3.1% 1.6% 0.4% -7.4% -24.4% • The Indian economy has demonstrated a V-shaped recovery in 2021, with an increase in consumer confidence, strong financial markets, and an improvement in manufacturing and exports. • India is among the fastest-growing economies in the world and it is set to surpass Japan and Germany to become the world's third-largest economy by 2029. • The most recent Industrial production numbers suggest that production expanded for the second consecutive month in December 2022, but growth eased to 4.3% from 7.3% in the preceding month, as tepid manufacturing took the sheen off the sharp rebound in mining and electricity. • India's GDP is estimated to be 2.73 trillion USD, and the government has set a target to reach 5 trillion USD by 2025. According to World Bank data, India's per capita GDP has grown significantly to 2100 USD. @ 2 0 2 3 A M I C U S A D V I S O R S , C O N F I D E N T I A L
India Freight Activity YOUR BUSINESS THINKTANK • E-way bills can be considered as a high-frequency indicator of economic activity. More goods transported across the country in December 2022 points towards strong GST collections in January 2023. • The e-way bill generation had moderated in October 2022 from the level seen in September 2022 due to the higher number of holidays in October. • However, the e-way bill generation picked up momentum in November and December 2022 as consumption remained strong. Eway Bill Generation (Pre to Post COVID) – in Mn 120.0 First Wave Third Wave Second Wave 100.0 80.0 60.0 40.0 20.0 - Jun-21 Oct-20 Oct-21 Oct-22 Jun-20 Aug-20 Aug-21 Nov-21 Jun-22 Aug-22 Mar-20 Sep-20 Mar-21 Sep-21 Mar-22 Sep-22 Jul-20 Jul-21 Jul-22 May-20 Nov-20 Dec-20 Jan-21 May-21 Dec-21 May-22 Nov-22 Dec-22 Jan-20 Jan-22 Feb-20 Apr-20 Feb-21 Apr-21 Feb-22 Apr-22 Intra Inter @ 2 0 2 3 A M I C U S A D V I S O R S , C O N F I D E N T I A L
Indian Logistics Industry YOUR BUSINESS THINKTANK 380 380 400 • The logistics sector globally has a market size of over USD 5.2 trillion. The sector accounts for between 8–20% of the country's GDP. 350 300 • Indian Logistics Market is estimated to grow to 380 billion dollars in 2025, at a compound annual growth rate between 10 to 12 percent. 250 250 250 In Billion Dollars • The Indian government has set a goal of reducing logistics costs to below 10% of the country's GDP. To achieve this, the government has launched several initiatives such as the National Logistics Policy, Gati Shakti Master Plan, and Sagarmala Project, among others. 200 170 170 150 • The e-commerce boom in India has also had a significant impact on the logistics industry, with companies such as Flipkart, Amazon, and other e-commerce driving demand for efficient and cost-effective logistics solutions. 100 50 0 2017 2021 2025 Source: Amicus Research, Industry Report @ 2 0 2 3 A M I C U S A D V I S O R S , C O N F I D E N T I A L
Budget 2023 – Logistics Perspective YOUR BUSINESS THINKTANK Allocation of 2.7 lakh crore for Ministry of Road Transport and Highways, up by 10% from the previous budget. Highest ever capital expenditure allocation to railway ministry in 2024. Total allocation of INR 2.4 trillion Labs for developing applications using 5G services to be set up in Engineering colleges. Applications include smart classrooms, precision farming, among others. INR 27,000 Crores allocated to Dedicated Freight Corporation of India which is 75% higher than the previous budget. Allocation to NCRTC for the country's first regional rapid transport system reduced by 23% to reach INR 3500 crore Coastal shipping to be promoted as an energy efficient mode of transportation, both for passengers and freight through PPP Model 100 critical transport infra projects to be taken up with an investment of INR 75,000 crores including 15,000 crores from the private sector. 50 additional airports, heliports, water aerodromes & advance landing grounds to be revive to improve regional air connectivity @ 2 0 2 3 A M I C U S A D V I S O R S , C O N F I D E N T I A L
National Logistics Policy YOUR BUSINESS THINKTANK • India’s logistics cost as a proportion of GDP is believed to be around 13-14 per cent. The government now aims to bring it down to single digits as soon as possible. • The Policy will help make the sector an integrated, cost-efficient, resilient, and sustainable logistics ecosystem in the country Key Building Blocks: 1. Digital Integration System: It will lead to seamless and faster work-flow, making logistics significantly more efficient. 2. Unified Logistics Interface Platform: It aims to collapse all logistics and transport sector digital services into a single portal, thereby freeing manufacturers and exporters from the present tyranny of long and cumbersome processes. 3. Ease of Logistics Services: E-Logs, a new digital platform, will allow industry to directly take up operational issues with government agencies for speedy resolution. 4. Comprehensive Logistics Action Plan: The Comprehensive Logistics Action Plan comprising integrated digital logistics systems, standardisation of physical assets, benchmarking service standards, human resource development, capacity building, development of logistics parks, etc. @ 2 0 2 3 A M I C U S A D V I S O R S , C O N F I D E N T I A L
Gati Shakti Master Plan YOUR BUSINESS THINKTANK Driven by seven engines: Roads, Railways, Airports, Ports, Mass Transport, Waterways ,and Logistics Infrastructure. National Master Plan aimed at world-class modern infrastructure and logistics synergy. • • Formulation of Master Plan for expressways. Completing 25000 km national highways in 2022-23 • Unified Logistics Interface Platform allowing data exchange among all mode operators Open Source Mobility Stack for seamless travel of passengers 4 Multimodal Logistics parks through PPP • • • Integration of Postal and Railways Network facilitating parcel movement. One Station One Product Extending coverage under Kavach 400 new generation of Vande Bharat Trains • • • Multimodal connectivity between mass urban transport and railway stations National Ropeways Development Plan as sustainable alternative to conventional roads. Capacity building for infrastructure Projects • • • @ 2 0 2 3 A M I C U S A D V I S O R S , C O N F I D E N T I A L
Industry Updates Q3 FY2023 YOUR BUSINESS THINKTANK Delhivery to acquire supply chain software firm Algorhythm for ₹14.90 cr Trucking aggregator Onmove recently announced that it has acquired 100% stake of Transin Logistics, a Hyderabad based trucking aggregation platform. Amazon launches dedicated air cargo service in India to speed up deliveries Logistics management firm Locad raises $11 million in Series-A funding Allcargo Logistics expands in Germany through acquisition of Fair Trade GmbH Freightify raises $12 million in series A led by Sequoia Capital Multimodal supply chain visibility startup Intugine raises Rs 19 crores in pre-series A @ 2 0 2 3 A M I C U S A D V I S O R S , C O N F I D E N T I A L
YOUR BUSINESS THINKTANK Quarterly Results Q3 FY2023
Industry Growth YOUR BUSINESS THINKTANK Revenue Growth (in INR Cr) Company Name QoQ YoY Q3 FY23 974 686 316 1,346 1,918 444 1,335 4,106 5,071 2,111 344 111 18,762 Q2 FY23 939 657 312 1,333 1,883 443 1,330 5,101 5,652 2,031 362 110 20,152 Growth(%) 3.6% 4.5% 1.1% 1.0% 1.8% 0.4% 0.4% -19.5% -10.3% 3.9% -5.0% 1.1% -6.9% Q3 FY23 Q3 FY22 Growth(%) 15.5% 13.1% 9.2% 6.1% -5.0% 6.8% 17.2% -26.8% 7.2% 5.9% -3.4% 48.6% -3.0% Transport Corporation of India VRL Logistics TCI Express Blue Dart Express Delhivery Gati Mahindra Logistics Allcargo Logistics Adani Ports & SEZ Container Corporation of India Gateway Distriparks Snowman Logistics Public Sub-group Total 974 686 316 1,346 1,918 444 1,335 4,106 5,071 2,111 344 111 18,762 843 606 289 1,269 2,019 416 1,139 5,613 4,728 1,994 356 75 19,348 @ 2 0 2 3 A M I C U S A D V I S O R S , C O N F I D E N T I A L
Industry Margins YOUR BUSINESS THINKTANK Q3 FY23 Q3 FY22 Company Name Company Name Revenue (in Cr) 974 686 316 1346 1,918 444 1,335 4,106 5,071 2,111 344 111 18,762 EBITDA Margin 12.5% 15.7% 15.0% 17.6% 1.1% 4.9% 5.1% 5.8% 58.6% 25.4% 27.3% 22.7% 23.9% Revenue (in Cr) 843 606 289 1269 2019 416 1139 5613 4728 1994 356 75 19,348 EBITDA Margin 13.6% 20.2% 17.0% 22.7% 3.9% 3.9% 4.2% 8.0% 68.9% 26.0% 28.2% 26.0% 26.1% Gross Margin Gross Margin Transport Corporation of India VRL Logistics TCI Express Blue Dart Express Delhivery Gati Mahindra Logistics Allcargo Logistics Adani Ports & SEZ Container Corporation of India Gateway Distriparks Snowman Logistics Public Sub-group Total 20.9% 32.1% 30.7% 42.0% 26.4% 24.6% 15.0% 22.7% 74.% 33.6% 39.9% 40.9% 40.0% Transport Corporation of India VRL Logistics TCI Express Blue Dart Express Delhivery Gati Mahindra Logistics Allcargo Logistics Adani Ports & SEZ Container Corporation of India Gateway Distriparks Snowman Logistics Public Sub-group Total 22.0% 35.8% 32.5% 47.5% 28.1% 22.5% 13.4% 18.6% 77.4% 33.5% 39.3% 49.2% 38.6% @ 2 0 2 3 A M I C U S A D V I S O R S , C O N F I D E N T I A L
Transport Corp of India YOUR BUSINESS THINKTANK In INR Cr Revenue & EBITDA(%) Q3 FY23 Dec-22 Q2 FY23 Sep-22 932.09 Q3 FY22 Dec-21 837.68 Particulars QoQ % YoY % 967 967 Operating Revenue Other Income Total Revenue Less: Operating Cost Operating Profit Operating Profit (%) Employee Cost Admin Cost EBITDA EBITDA% Finance Cost Depreciation Exceptional Items & Profit of JV & Associate PBT Tax PAT PAT % EPS 966.70 7.05 973.75 770.22 203.53 20.9% 49.28 32.79 121.46 12.5% 2.61 31.39 3.71% -4.34% 3.65% 2.37% 8.82% 15.40% 32.52% 15.51% 17.14% 9.74% 932 7.37 5.32 14% 939.46 752.42 187.04 19.9% 49.23 34.48 103.33 11.0% 2.54 30.03 843.00 657.54 185.46 22.0% 43.67 27.29 114.50 13.6% 2.59 25.52 12.50 % 12.50% 838 11% 0.10% -4.90% 17.55% 12.85% 20.15% 6.08% Q2 FY 23 Q3 FY 23 Q3 FY 22 Q3 FY 23 QoQ QoQ YoY YoY 2.76% 4.53% 0.77% 23.00% Operating Cost Employee Cost Admin Cost Finance Cost Depreciation Tax Profit 79% 5% 3% 0% 3% 1.1% 8.9% 10.18 13.83 7.22 -26.39% 41.00% 97.64 11.04 86.60 8.9% 11.08 84.59 11.59 73.00 7.8% 9.34 93.61 10.80 82.81 9.8% 10.61 15.43% -4.75% 18.63% 4.31% 2.22% 4.58% 18.63% 4.43% @ 2 0 2 3 A M I C U S A D V I S O R S , C O N F I D E N T I A L
Transport Corp of India YOUR BUSINESS THINKTANK Management Comments Management Comments • In Quarter 3 of the financial year, the company has accomplished consistent performance amidst a stable macro environment. All our business segments have delivered satisfactory results in line with expectations • While we keep a balanced view on the industrywide challenges around inflation and tightening of credit we are confident of achieving our goals to build an integrated multi-modal logistics solutions organization. At TCI, our value system and our people remain at the core our customers' success • But certainly what we are seeing is that the consumer trends for this particular quarter are a little weaker than the previous quarter • But predominantly on the B2B side, which is where we are active, we are really not seeing any kind of a slowdown or any kind of a degrowth happening. • The freight business grew at about 14% in the quarter, and the company is confident of achieving a 40% RoCE by 2025. @ 2 0 2 3 A M I C U S A D V I S O R S , C O N F I D E N T I A L
Transport Corp of India YOUR BUSINESS THINKTANK • A pioneer in providing integrated multimodal logistics and supply chain solutions. • It provides an array of end-to-end logistics and supply chain solutions in India and SAARC countries through multiple modes, including road, rail, and sea. • TCI Group has a strong presence in the SAARC countries. It caters to Nepal, Bangladesh, Bhutan, Sri Lanka with offices at borders & capital cities. Particulars Market Cap as on 31 Dec 2022 (in Cr) 4,797 PE Ratio 14.92 Return on Capital Employed 17.1% A) Freight Division (47% of FY22 revenue) A) Freight Division (47% of FY22 revenue) It can manage any size and dimension of cargo or product such as FTL, LTL ,ODC (Over Dimensional Cargoes), PHH (Project Heavy Haul), and Foldable Large Containers (FLCs). DSO (as on 31.3.2022) 57 Sales (as on 31.3.2022) 3,257 B) Supply Chain Solutions (34%) B) Supply Chain Solutions (34%) It caters to demands in key industry verticals such as Healthcare, Chemical, Hi- Tech, Retail & CP’s Auto, among others. Account Receivable (as on 31.3.2022) 508 Operating Profit (%) 20.9% EBITDA Margin (%) 12.5% C) Sea Freight (18%) C) Sea Freight (18%) TCI Seaways is India’s leading multi-modal coastal player, connecting India’s western, eastern and southern ports. The division has extensive knowledge and expertise in coastal shipping, container cargo movement, liner, charter, first and last-mile connectivity via rail and road. PAT Margin (%) 8.9% @ 2 0 2 3 A M I C U S A D V I S O R S , C O N F I D E N T I A L
VRL Logistics YOUR BUSINESS THINKTANK In INR Cr Revenue & EBITDA(%) Q3 FY23 Dec-22 Q2 FY23 Sep-22 654.47 Q3 FY22 Dec-21 601.45 Particulars QoQ % YoY % 682 682 Operating Revenue Other Income Total Revenue Less: Operating Cost Operating Profit Operating Profit (%) Employee Cost Admin Cost EBITDA EBITDA% Finance Cost Depreciation Exceptional Items & Profit of JV & Associate PBT Tax PAT PAT % EPS 681.53 4.48 686.01 465.64 220.37 32.1% 104.42 8.19 107.76 15.7% 15.07 42.10 4.13% 103.64% 4.47% 3.63% 6.28% 13.31% -8.76% 13.14% 19.62% 1.50% 20% 654 2.20 4.91 15.70 % 656.67 449.33 207.34 31.6% 103.64 8.47 95.23 14.5% 13.93 38.38 606.36 389.25 217.11 35.8% 87.17 7.47 122.47 20.2% 11.55 38.38 15.70 % 14.50 % 601.45 0.75% -3.31% 13.16% 19.79% 9.64% -12.01% Q2 FY 23 Q3 FY 23 Q3 FY 22 Q3 FY 23 QoQ QoQ YoY YoY 8.18% 9.69% 30.48% 9.69% Operating Cost Employee Cost Admin Cost Finance Cost Depreciation Tax Profit 68% 15% 1% 2% 6% 2% 7% 15.32 1.05 5.21 1359.05% 194.05% 65.91 16.70 49.21 7.2% 5.57 43.97 12.51 31.46 4.8% 3.56 77.75 17.24 60.51 10.0% 6.85 49.90% 33.49% 56.42% -15.23% -3.13% -18.67% 56.46% -18.69% @ 2 0 2 3 A M I C U S A D V I S O R S , C O N F I D E N T I A L
VRL Logistics YOUR BUSINESS THINKTANK Management Comments Management Comments • We are glad to inform you that as we strategized to focus on high growth goods transport business the exit from the remaining segment process has been completed as on date. • The increase in revenue is mainly on account of increase in tonnage which has been reached to 10,10,000 tonnes in the current quarter as against 8,77,000 tonnes in the previous year which is increased by almost around 15%. • We added around 218 branches post pandemic and these branches have contributed around 12% to the total tonnage in Q3. Our strategy of expansion of branch network is going to be continued. I am planning to add around 25 to 30 branches every quarter especially in the untapped market. • Some of the sectors have grown tremendously in the current quarter, to name a few the agro products and equipment these commodities have been increased by around 47% on year-on-year basis, the automobiles has been increased by around 25%, the educational goods related items which is increased by around 31%, FMCG products are increased by around 23%, footwear is around 36%, and metals and hardware around 28%. @ 2 0 2 3 A M I C U S A D V I S O R S , C O N F I D E N T I A L
VRL Logistics YOUR BUSINESS THINKTANK VRL is an established logistics service provider in India with the largest fleet of owned vehicles in the country, comprising a fleet of 5111 vehicles (including 4,852 goods transport vehicles and 295 passenger buses), and operational infrastructure facilities spread across 956 locations. Particulars Market Cap as on 31 Dec 2022 (in Cr) 4,784 A) Goods Transport (89%) A) Goods Transport (89%) VRL offers its goods transportation services across 23 States and, 5 Union Territories covering all major cities and towns in India. VRL has its exclusive offices across 553 towns and cities in India. Operations in this division are conducted through a network of 908 branches and agencies. PE Ratio 25.66 Return on Capital Employed 17.7% B) Bus Operations (9%) B) Bus Operations (9%) VRL is one of the front runners in the Indian Passenger Travel Industry amongst the private sector players. These operations are conducted under the aegis of "VIJAYANAND TRAVELS" covering more than 350 routes connecting nearly 100 destinations with over 295 luxury Buses / Coaches. DSO (as on 31.3.2022) 10 Sales (as on 31.3.2022) 2,394 C) Sale of Power (1%) C) Sale of Power (1%) The company currently has 32 windmills at Gadag with a total capacity of 40 MW, supported by a 20-year power purchase agreement (PPA) with the Hubli Electricity Supply Company Limited. Account Receivable (as on 31.3.2022) 67 Operating Profit (%) 32.1% D) Air Charter (0.5%) D) Air Charter (0.5%) In 2008, VRL Logistics Ltd. ventured into the Transport of Passengers by Air Industry. VRL decided to enter the Transport of Passengers by Air Industry and serve VVIPs, VIPs & Corporate India. EBITDA Margin (%) 15.7% PAT Margin (%) 7.2% @ 2 0 2 3 A M I C U S A D V I S O R S , C O N F I D E N T I A L
TCI Express YOUR BUSINESS THINKTANK In INR Cr Q3 FY23 Dec-22 Q2 FY23 Sep-22 309.90 Q3 FY22 Dec-21 286.92 Revenue & EBITDA(%) Particulars QoQ % YoY % Operating Revenue Other Income 314.42 1.30 1.46% 9.58% 17.2% 314 17.0% 314 310 2.27 2.07 -42.73% -37.20% Total Revenue Less: Operating Cost Operating Profit Operating Profit(%) Employee Cost 315.72 218.89 96.83 30.7% 31.18 312.17 210.65 101.52 32.5% 30.90 288.99 195.14 93.85 32.5% 27.73 1.14% 9.25% 287 3.91% 12.17% -4.62% 3.18% 15.0% 15.0% 0.91% 12.44% Q2 FY 23 Q3 FY 23 Q3 FY 22 Q3 FY 23 QoQ QoQ YoY YoY Admin Cost 18.27 16.87 16.87 8.30% 8.30% EBITDA EBITDA% Finance Cost 47.38 15.0% 0.44 53.75 17.2% 0.35 49.25 17.0% 0.19 -11.85% -3.80% Operating Cost Employee Cost Admin Cost Finance Cost Depreciation Tax Profit 69% 10% 6% 0% 1% 3% 10% 25.71% 131.58% Depreciation 4.29 3.49 2.23 22.92% 92.38% PBT 42.65 49.91 46.83 -14.55% -8.93% Tax 10.63 12.12 11.71 -12.29% -9.22% PAT PAT % EPS 32.02 10.1% 8.32 37.79 12.1% 9.82 35.12 12.2% 9.12 -15.27% -8.83% -15.27% -8.77% @ 2 0 2 3 A M I C U S A D V I S O R S , C O N F I D E N T I A L
TCI Express YOUR BUSINESS THINKTANK Management Comments Management Comments • The growth was primarily driven by strong demand from the festive season, growth in the Index of Industrial Production and E Way bill generation which ended on a strong note. • On the investment side, during the 9 M FY 2023 we incurred a capex of Rs 98.5 crores, primarily spent towards the acquisition of land for setting up new automated sorting center in Kolkata and for new corporate office in Gurgaon. • We added 28 new branches in the West and South region to expand our presence to cater the growing demand with industry leading services • Among our newly launched services, Rail Express offering getting good traction from customers and we expanded customer base from 250 to 1750 and presence from 10 routes to 125 routes since our inception • New services ( Rail Express, C2C Express, Pharma Cold Chain Express and Air Express) are expected to contribute 25% to top line. @ 2 0 2 3 A M I C U S A D V I S O R S , C O N F I D E N T I A L
TCI Express YOUR BUSINESS THINKTANK Particulars • TCI Express Limited is an express cargo logistics company with its own set up across India. It carries distribution through various modes of transport and is specialized in offering time definite solutions. • Asset-Light Business Model: The Co does not have any fleet on its books and relies on the fleet hired from attached business vendors • The Co. launched value added services such as Pharma Cold Chain, C2C and rail express in FY 22 which contributed approximately 15% towards the Co.’s revenue. Market Cap as on 31 Dec 2022 (in Cr) 6,901 PE Ratio 50.53 Return on Capital Employed 37.6% DSO (as on 31.3.2022) 64 Services Services • Surface Express- The Co offers express pick-up and delivery in India at 40,000 locations • Domestic Air Express- The Co delivers in all major metros in 24 hours and Mini Metros and A-class cities in 48 hours. • International Air Express- The Co provides services to around 208 countries across the globe (Commercial/Non-Commercial) from over 3000 pickup points in India. • E-Commerce Express- The Co is a vendor to warehouses and inter warehouses. It has IT interfaces with customers and Real-Time tracking API with an easy customer login portal. Sales (as on 31.3.2022) 1,081 Account Receivable (as on 31.3.2022) 190 Operating Profit (%) 30.7% EBITDA Margin (%) 15.0% PAT Margin (%) 10.1% @ 2 0 2 3 A M I C U S A D V I S O R S , C O N F I D E N T I A L
Blue Dart Express YOUR BUSINESS THINKTANK In INR Cr Q3 FY23 Q2 FY23 Q3 FY22 Revenue & EBITDA(%) Particulars QoQ % YoY % Dec-22 1,337.08 Sep-22 1,325.28 Dec-21 1,254.75 14.36 1,269.11 665.83 603.28 47.5% 207.36 107.89 288.03 22.7% 19.56 103.09 1337 1337 22.70 % Operating Revenue Other Income Total Revenue Less: Operating Cost Operating Profit Operating Profit (%) Employee Cost Admin Cost EBITDA EBITDA% Finance Cost Depreciation Exceptional Items & Profit of JV & Associate PBT Tax PAT PAT % EPS 0.89% 6.56% 1325 8.95 7.68 16.54% -37.67% 1,346.03 781.16 564.87 42.0% 203.32 124.55 237.00 17.6% 15.92 99.60 1,332.96 783.61 549.35 41.2% 209.67 89.01 250.67 18.8% 18.41 101.13 0.98% 6.06% 18.80 % 17.60 % 17.60 % 1255 -0.31% 17.32% 2.83% -6.37% -3.03% -1.95% Q2 FY 23 Q3 FY 23 Q3 FY 22 Q3 FY 23 39.93% 15.44% QoQ QoQ YoY YoY -5.45% -17.72% -13.53% -18.61% -1.51% -3.39% Operating Cost Employee Cost Admin Cost Finance Cost Depreciation Tax Profit 58% 15% 9% 1% 7% 2.4% 6.6% - - - 121.48 32.82 88.66 6.6% 36.64 131.13 37.49 93.64 7.0% 38.78 165.38 41.96 123.42 9.7% 51.49 -7.36% -26.54% -12.46% -21.78% -5.32% -28.16% -5.52% -28.84% @ 2 0 2 3 A M I C U S A D V I S O R S , C O N F I D E N T I A L
Blue Dart Express YOUR BUSINESS THINKTANK Management Comments Management Comments • During the quarter, Blue Dart said, the geo-political scenario continues to remain volatile. International crude prices and foreign currencies specifically witnessed high volatility, leading to a high inflationary ecosystem. • The company has been working on enhancing its package handling capacity on air and ground to handle increased volume and improve service quality • We are expanding our presence in tier II & III markets. We have about 700 retail stores (with DHL) across India. Additionally, we plan to set up about 100 new stores in the near future to aggressively expand our channel footprint @ 2 0 2 3 A M I C U S A D V I S O R S , C O N F I D E N T I A L
Blue Dart Express YOUR BUSINESS THINKTANK • Blue Dart Express Limited, incorporated in 1983, is involved in transportation and door-to-door distribution of time-sensitive shipments, through an integrated ground and air transportation network. • The company is regarded as South Asia’s leading courier and integrated air express package distribution company • In FY22, 99% of the shipments were domestic, total of 9 lakh international shipments overall weight more than 932,690 tonnes. • The company has warehouses at 85 locations across the country as well as bonded warehouses in the 7 major metros Particulars Market Cap as on 31 Dec 2022 (in Cr) 18,285 PE Ratio 41.65 Return on Capital Employed 22.2% DSO (as on 31.3.2022) 48 Services Services Sales (as on 31.3.2022) 4,410 Domestic Priority day-definite and time-definite services: It enables deliveries at predefined times for critical shipments such as passports, tenders, original papers/certificates, etc. under 32kgs per package. Industry-specific services: Temperature Controlled Logistics products, tailored specifically for customers in the Life Sciences & Healthcare sector, various types of thermal packaging, etc. Critical Express: It caters to an essential domestic need for the safe movement of passports, tenders, and other securitized items. Account Receivable (as on 31.3.2022) 580 Operating Profit (%) 42.0% EBITDA Margin (%) 17.6% PAT Margin (%) 6.6% @ 2 0 2 3 A M I C U S A D V I S O R S , C O N F I D E N T I A L
Delhivery YOUR BUSINESS THINKTANK In INR Cr Q3 FY23 Dec-22 1,823.84 Q2 FY23 Sep-22 1,796.10 87.29 1,883.39 1,435.84 447.55 23.8% 352.82 145.13 -50.40 -2.7% 23.96 200.05 Q3 FY22 Dec-21 1,995.04 24.16 2,019.20 1,452.77 566.43 28.1% 321.91 166.18 78.34 Revenue & EBITDA(%) Particulars QoQ % YoY % 3.90% 1995 Operating Revenue Other Income Total Revenue Less: Operating Cost Operating Profit Operating Profit (%) Employee Cost Admin Cost EBITDA EBITDA% Finance Cost Depreciation Exceptional Items & Profit of JV & Associate PBT Tax PAT PAT % EPS 1.54% 8.00% 1.84% -1.73% 13.29% -8.58% 290.19% -5.01% -2.87% -10.48% 94.27 1,918.11 1,411.07 507.04 26.4% 339.62 146.42 21.00 1.10% 1.10% 1824 1824 1796 -2.70% -3.74% 0.89% -141.67% 5.50% -11.89% -73.19% Q2 FY 23 Q3 FY 23 Q3 FY 22 Q3 FY 23 QoQ QoQ YoY YoY 1.1% 21.36 207.30 3.9% 27.62 186.54 -10.85% 3.62% -22.66% 11.13% Operating Cost Employee Cost Admin Cost Finance Cost Depreciation Tax Profit 74% 18% 8% 1% 11% -1% -10% -1.37 8.17 - -209.03 -13.37 -195.66 -10.2% -2.65 -266.24 -12.13 -254.11 -13.5% -135.82 -9.31 -126.51 -6.3% -2.18 -21.49% 10.22% -23.00% 53.90% 43.61% 54.66% 3.43 -177.26% 21.56% @ 2 0 2 3 A M I C U S A D V I S O R S , C O N F I D E N T I A L
Delhivery YOUR BUSINESS THINKTANK Management Comments Management Comments • The incremental gross margin trend for the business has continued into quarter three and operating leverage in the business has remained intact, while service standards have improved. • We delivered 258,000 tonnes of Part Truckload freight in quarter three fiscal ’23. We’ve delivered about 3 million tonnes, since fiscal ’19. More importantly, in December, we delivered about 98,000 tonnes of PTL freight. • At the end of financial ’22, we were in 18,074 pin codes, that has expanded to 18,510 pin codes as of Q3 FY2023. This is a regular operational expansion that we expect will continue in Q4 and beyond. • On Express Parcel, between Q2 FY2023 and Q3 FY2023, we’ve seen growth quarter-on-quarter of about 7%. We closed the quarter at about INR1,200 crores of revenue in Q3 FY2023. We delivered close to 170 million shipments in Q3 FY2023. • Our sense is that, at the conservative end, e-commerce volumes should be expected to grow in sort of the 15% to 20% range. @ 2 0 2 3 A M I C U S A D V I S O R S , C O N F I D E N T I A L
Delhivery YOUR BUSINESS THINKTANK Particulars • Delhivery provides a full range of Logistics services, including delivery of express parcels and heavy goods, PTL freight, TL freight, warehousing, supply chain solutions, cross-border Express, freight services, and supply chain software. • Delhivery operated 22 fully and semi-automated sortation centers. • Delhivery has 80+ applications through which they provide various services, orchestrated by their platform to govern end-to-end transaction flows Market Cap as on 31 Dec 2022 (in Cr) 24,137 PE Ratio - Return on Capital Employed -19.4% DSO (as on 31.3.2022) 48 Sales (as on 31.3.2022) 5,911 Key Metrics: Dec 2022 Key Metrics: Dec 2022 Pin Code Reach – 18,510 No. of gateways – 92 Fleet Size– 11,703 Team size – 52,789 No. of Active Customers- 26,845 Services Services Express Parcel services – (66%) Part Truck Load services – (15%) Truck Load Services – (4%) Supply chain services – (10%) Cross Border service – (5%) Account Receivable (as on 31.3.2022) 775 Operating Profit (%) 26.4% EBITDA Margin (%) 1.1% PAT Margin (%) -10.2% @ 2 0 2 3 A M I C U S A D V I S O R S , C O N F I D E N T I A L
Gati YOUR BUSINESS THINKTANK In INR Cr Q3 FY23 Dec-22 Q2 FY23 Sep-22 435.15 Q3 FY22 Dec-21 413.76 Revenue & EBITDA(%) Particulars QoQ % YoY % 441 441 Operating Revenue Other Income Total Revenue Less: Operating Cost Operating Profit Operating Profit(%) Employee Cost Admin Cost EBITDA EBITDA% Finance Cost Depreciation 441.35 2.85 444.20 334.82 109.38 24.6% 47.21 40.62 21.55 4.9% 7.08 15.10 1.42% -61.74% 0.36% 2.52% -5.71% 6.67% 26.67% 6.78% 3.89% 16.70% 435 7.45 2.25 7.00% 442.60 326.60 116.00 26.2% 47.80 37.28 30.92 7.0% 7.58 13.36 416.01 322.28 93.73 22.5% 39.03 38.36 16.34 3.9% 5.78 7.03 414 4.90% 4.90% 3.90% -1.23% 8.96% -30.30% 20.96% 5.89% 31.88% Q2 FY 23 Q3 FY 23 Q3 FY 22 Q3 FY 23 QoQ QoQ YoY YoY -6.60% 13.02% 22.49% 114.79% Operating Cost Employee Cost Admin Cost Finance Cost Depreciation Tax Profit 75% 11% 9% 2% 3% 1% -1% PBT -0.63 9.98 3.53 -106.31% -117.85% Tax 4.07 2.33 -1.49 74.68% -373.15% PAT -4.70 7.65 5.02 -161.44% -193.63% PAT % -1.1% 1.7% 1.2% EPS -0.26 0.48 0.31 -154.17% -183.87% *Company reported attributable Loss to Gati is 3.33 Cr @ 2 0 2 3 A M I C U S A D V I S O R S , C O N F I D E N T I A L
Gati YOUR BUSINESS THINKTANK Management Comments Management Comments • The company has recorded highest ever quarterly revenue for Q3 FY23 which stands at ₹379 crore. This performance reflects companies’ focus on customer delight and operational efficiency. • In the next phase of infrastructure development, we’ll be setting up four surface transhipment hubs in Bengaluru, Hyderabad, Indore and Kolkata. • Hub modernisation and enhanced automation will lead to better efficiency which will translate to higher volumes. • Gati has launched strategically located state-of-the-art and tech-enabled surface transhipment centre (STC) in Nagpur recently, with this now we have four operational hubs in Mumbai, Farukhnagar and Guwahati. • Keeping an eye on improving the cost, company has launched over 20 EV’s for first mile and last delivery @ 2 0 2 3 A M I C U S A D V I S O R S , C O N F I D E N T I A L
Gati YOUR BUSINESS THINKTANK Particulars Gati Ltd is primarily engaged in express distribution and supply chain solution through surface, air and rail logistics, supply chain management (SCM), E-comm logistics, freight forwarding and cold chain - transportation and warehousing. Market Cap as on 31 Dec 2022 (in Cr) 1,485 PE Ratio - At a group level, the company has a network of 600+ offices including 18 large hubs, operating a fleet of 5,000 vehicles on road and has 7,000+ business partners across India.[10] It has a nationwide coverage to 99% of districts and pincodes across India Return on Capital Employed 4.2% DSO (as on 31.3.2022) 57 (A) Express Distribution & Supply Chain Division (~86% of revenues) (A) Express Distribution & Supply Chain Division (~86% of revenues) • Surface (92%) • Air Freight (4.5%) • Supply Chain Management (3.5%) Sales (as on 31.3.2022) 1,490 Account Receivable (as on 31.3.2022) 232 Operating Profit (%) 24.6% (B)Fuel Stations Business (~19% of revenues) (B)Fuel Stations Business (~19% of revenues) Presently, the company owns and operates 5 fuel stations at Bangalore, Belgaum, Indore, Shadnagar (Hyderabad) and Chattra, Karnataka. EBITDA Margin (%) 4.9% PAT Margin (%) -1.1% @ 2 0 2 3 A M I C U S A D V I S O R S , C O N F I D E N T I A L
Mahindra Logistics YOUR BUSINESS THINKTANK In INR Cr Revenue & EBITDA(%) Q3 FY23 Dec-22 1,329.55 Q2 FY23 Sep-22 1,326.33 Q3 FY22 Dec-21 1,136.00 Particulars QoQ % YoY % 1330 1330 1326 Operating Revenue Other Income Total Revenue Less: Operating Cost Operating Profit Operating Profit (%) Employee Cost Admin Cost EBITDA EBITDA% Finance Cost Depreciation Exceptional Items & Profit of JV & Associate PBT Tax PAT PAT % EPS 0.24% 66.57% 0.41% -1.09% 9.80% 17.04% 93.75% 17.23% 14.95% 32.01% 5.58 3.35 2.88 5.30% 1,335.13 1,134.23 200.90 1,329.68 1,146.71 182.97 1,138.88 986.69 152.19 5.10% 5.10% 1136 4.20% 15.0% 94.48 38.10 68.32 5.1% 14.97 49.80 13.8% 83.00 29.03 70.94 5.3% 10.74 43.55 13.4% 80.34 23.63 48.22 4.2% 7.52 37.50 13.83% 31.24% -3.69% 17.60% 61.24% 41.68% Q2 FY 23 Q3 FY 23 Q3 FY 22 Q3 FY 23 QoQ QoQ YoY YoY 39.39% 14.35% 99.07% 32.80% Operating Cost Employee Cost Admin Cost Finance Cost Depreciation Tax Profit 85% 7% 3% 1% 4% 0.1% 0.1% - - - 3.55 1.88 1.67 0.1% 0.19 16.65 4.74 11.91 0.9% 1.69 3.20 2.05 1.15 0.1% 0.25 -78.68% -60.34% -85.98% 10.94% -8.29% 45.22% -88.76% -24.00% *Company reported attributable Profit to Mahindra is Rs 1.32 Cr @ 2 0 2 3 A M I C U S A D V I S O R S , C O N F I D E N T I A L
Mahindra Logistics YOUR BUSINESS THINKTANK Management Comments Management Comments • The consumer and e-commerce businesses did witness a softer demand environment. • Mahindra Logistics also flagged weakness in its freight forwarding service due to a sharp drop in freight rates. • During this quarter, we witnessed robust growth in auto and manufacturing, which offset for some slowness in some of the other segments, especially e-commerce. • During the quarter, we saw the completion of the acquisition of the B2B express business of Rivigo to a subsidiary called MESPL. Almost 90% plus of the customers have been transitioned successfully, and we’ve been able to improve our service levels on most of the critical deals. @ 2 0 2 3 A M I C U S A D V I S O R S , C O N F I D E N T I A L
Mahindra Logistics YOUR BUSINESS THINKTANK • Mahindra Logistics is a business venture of Mahindra group in the logistics sphere that provides supply chain expertise to 400+ corporates in diverse verticals like Automotive, Engineering, Consumer Goods, etc. • The company has two subsidiaries- Lords and 2x2. Lords provides international freight forwarding services for exports and imports, customs brokerage, etc while 2x2 specializes in offering automotive outbound logistics solutions to 4W and 2W industries. • The Co. has 17.5 million sq. ft. of warehousing space and a growing cross- border supply chain business. Particulars Market Cap as on 31 Dec 2022 (in Cr) 3,613 PE Ratio 104.54 Return on Capital Employed 14.8% DSO (as on 31.3.2022) 43 Financial performance Financial performance Sales (as on 31.3.2022) 4,083 • In FY22, the Co. earned approx. 96% of its entire revenues from domestic markets. The company’s export contribution was 4%. Account Receivable (as on 31.3.2022) 479 • In FY22, the company earned 77% of its revenue from transportation, 19% from warehousing and related activities and 4% from enterprise mobility services. Operating Profit (%) 15.0% • Additionally, the company derived 48% of its revenues from its parent company in FY22. EBITDA Margin (%) 5.1% PAT Margin (%) 0.1% @ 2 0 2 3 A M I C U S A D V I S O R S , C O N F I D E N T I A L
Allcargo Logistics YOUR BUSINESS THINKTANK In INR Cr Revenue & EBITDA(%) Q3 FY23 Dec-22 4,099.02 Q2 FY23 Sep-22 5,078.80 21.91 5,100.71 4,071.73 1,028.98 Q3 FY22 Dec-21 5,599.41 13.86 5,613.27 4,570.38 1,042.89 18.6% 435.66 159.38 447.85 Particulars QoQ % YoY % 5599 Operating Revenue Other Income Total Revenue Less: Operating Cost Operating Profit Operating Profit (%) Employee Cost Admin Cost EBITDA EBITDA% Finance Cost Depreciation Exceptional Items & Profit of JV & Associate PBT Tax PAT PAT % EPS -19.29% -66.23% -19.49% -22.00% -9.58% -26.80% -46.61% -26.84% -30.51% -10.79% 5079 8.0% 7.40 7.60% 4099 4099 4,106.42 3,176.02 930.40 22.7% 505.68 188.34 236.38 5.80% 5.80% 20.2% 477.01 164.08 387.89 7.6% 23.73 64.84 6.01% 14.79% -39.06% 16.07% 18.17% -47.22% Q2 FY 23 Q3 FY 23 Q3 FY 22 Q3 FY 23 QoQ QoQ YoY YoY 5.8% 22.29 69.34 8.0% 20.15 59.60 -6.07% 6.94% 10.62% 16.34% Operating Cost Employee Cost Admin Cost Finance Cost Depreciation Tax Profit 77% 12% 5% 1% 2% 0.3% 3.0% -6.71 11.25 30.07 138.04 13.61 124.43 3.0% 310.57 117.77 192.80 398.17 74.21 323.96 5.8% 13.58 -55.55% -88.44% -35.46% -65.33% -81.66% -61.59% 3.8% 8.61 6.35 -26.25% -53.24% @ 2 0 2 3 A M I C U S A D V I S O R S , C O N F I D E N T I A L
Allcargo Logistics YOUR BUSINESS THINKTANK Management Comments Management Comments • I’m glad to state that our flagship business of LCL consolidation, which is the — contributes to almost 70% of gross profit in the international supply chain business, has continued to see market-share expansion. And for the first time, we have now crossed 15% global market share in LCL as we speak today. • On the FCL business, given the macroeconomic slowdown, we have seen a flattening of volume. • On the trade lanes, we already operate about more than 2,400 direct trade lanes globally, which is by far the highest for any LCL operator or any other carriers globally. • From a freight trade perspective, we have already seen that freight trades have come back to the near pre- COVID levels. • Contract Logistics revenue for the quarter stood at almost INR100 crores and EBITDA stood at INR31 crores. Compared to the CFS and ICD segments, we are poised to deliver growth to enhance customer experience with My-CFS initiative and better import-export mix. @ 2 0 2 3 A M I C U S A D V I S O R S , C O N F I D E N T I A L
Allcargo Logistics YOUR BUSINESS THINKTANK Key Business Highlights Key Business Highlights • Consolidated debt as of 31st December’22 stood at ₹ 130 crores. Post 31st December’22 Blackstone transaction has been signed and a total debt of ₹ 295 crore has been alienated from Allcargo books The company has also received additional cash inflow of over ₹135crores • The company is in process of acquiring 30% stake from KWE in the operating entity • Acquired 75% stake in Fair Trade (Germany) through ECU, Belgium significantly strengthening position in a key market • ACCI has received NCLT order for de-merger of contract logistics • business into ASCPL, which is currently 100% subsidiary of Allcargo • Logistics Particulars Market Cap as on 31 Dec 2022 (in Cr) 9,925 PE Ratio 11.27 Return on Capital Employed 15.2% DSO (as on 31.3.2022) 56 Sales (as on 31.3.2022) 20,072 Key Financial Highlights Key Financial Highlights • Decline in revenue is largely on account of ocean freight rate decline, which is mostly a pass through and hence a similar decline in operating expenses is also visible, barring partial impact on FCL business and investments in new trade lanes • Increased SG&A is on account of inflation as well as business expansion, as we continue to invest in people and capabilities to build new products and trade lanes Account Receivable (as on 31.3.2022) 3,076 Operating Profit (%) 22.7% EBITDA Margin (%) 5.8% PAT Margin (%) 3.0% @ 2 0 2 3 A M I C U S A D V I S O R S , C O N F I D E N T I A L
Adani Ports & SEZ YOUR BUSINESS THINKTANK In INR Cr Revenue & EBITDA(%) Q3 FY23 Dec-22 4,786.17 265.00 5,051.17 1,276.42 3,774.75 Q2 FY23 Sep-22 5,210.80 438.11 5,648.91 1,414.67 4,234.24 75.0% 233.12 672.40 3,328.72 58.9% 577.05 854.30 Q3 FY22 Dec-21 4,071.98 641.39 4,713.37 1,064.76 3,648.61 77.4% 187.00 221.05 3,240.56 68.8% 667.70 783.79 Particulars QoQ % YoY % 5211 68.80 % Operating Revenue Other Income Total Revenue Less: Operating Cost Operating Profit Operating Profit (%) Employee Cost Admin Cost EBITDA EBITDA% Finance Cost Depreciation Exceptional Items & Profit of JV & Associate PBT Tax PAT PAT % EPS -8.15% -39.51% -10.58% -9.77% -10.85% 17.54% -58.68% 7.17% 19.88% 3.46% 4786 4786 58.60 % 58.60 % 58.90 % 4072 74.7% 227.37 585.88 2,961.50 58.6% 533.88 883.63 -2.47% -12.87% -11.03% 21.59% 165.04% -8.61% Q2 FY 23 Q3 FY 23 Q3 FY 22 Q3 FY 23 QoQ QoQ YoY YoY -7.48% 3.43% -20.04% 12.74% Operating Cost Employee Cost Admin Cost Finance Cost Depreciation Tax Profit 25% 5% 12% 11% 17% 4.5% 26.1% 19.91 3.02 15.02 1,543.99 227.39 1,316.60 26.1% 1,897.37 162.58 1,734.79 30.7% 1,789.07 268.81 1,520.26 32.3% -18.62% 39.86% -24.11% -13.70% -15.41% -13.40% 6.09 7.77 7.25 -21.62% -16.00% @ 2 0 2 3 A M I C U S A D V I S O R S , C O N F I D E N T I A L
Adani Ports & SEZ YOUR BUSINESS THINKTANK Management Comments Management Comments • With the highest ever revenue and EBITDA over a nine-month period, ASPEZ is well placed to achieve the upper end of its full-year revenue and EBITDA guidance provided for FY23 • APSEZ is also targeting FY24 EBITDA of Rs 14,500-15,000 crore. • Besides an estimated capital expenditure of Rs 4,000-4,500 crore, we are considering total loan repayment and prepayment of around Rs 5,000 crore, which will significantly improve our Net Debt to EBITDA ratio and bring it closer to 2.5x by March 24 • With a port EBITDA margin of 70%, Adani Ports said it continues to be one of the most profitable port companies globally. • EBITDA of the logistics business segment jumped 66% YoY to Rs 354 crore, supported by margin expansion of 400 basis points with improved utilization of assets and increased share of the GPWIS revenue stream. • Given our increased focus of providing supply chain solutions to our customers at their doorstep, our logistics business segment is experiencing phenomenal growth @ 2 0 2 3 A M I C U S A D V I S O R S , C O N F I D E N T I A L
Adani Ports & SEZ YOUR BUSINESS THINKTANK • Started in 1998 by Gautam Adani, Adani Ports and Special Economic Zone Ltd. is a ports company of the Adani Group having 10 ports, comprising 45 berths and 14 terminals across 6 states. • The company is also the owner of largest private port of India, Mundra Port which hosts world’s largest coal import terminal. • As of 2022, the company has a revenue of over 18,000 crore and provides employment to over 2200 people. Particulars Market Cap as on 31 Dec 2022 (in Cr) 1,76,710 PE Ratio 33.53 Return on Capital Employed 16.7% Services Services DSO (as on 31.3.2022) 57 The company has seven logistic parks in different parts of the country with a capacity of 500,000 TEUs. It also has six inland vessels with capacities ranging from 64 TEU to 68 TEU. The company is also the largest private container train operator in the country, operating 43 trains under Category 1 license issued by the Indian Railways. Sales (as on 31.3.2022) 15,934 Account Receivable (as on 31.3.2022) 2,470 The company also has a warehousing capacity of 400,000 sq feet.. In the domain of agri logistics, the company has 21 storage infrastructure facilities in 9 states across India. The company also operates 7 BCBFG rakes for transportation of food grains from base depots in North to field depots across numerous locations in India Operating Profit (%) 74.7% EBITDA Margin (%) 58.6% PAT Margin (%) 26.1% @ 2 0 2 3 A M I C U S A D V I S O R S , C O N F I D E N T I A L
Container Corporation of India YOUR BUSINESS THINKTANK In INR Cr Q3 FY23 Dec-22 Q2 FY23 Sep-22 Q3 FY22 Dec-21 Revenue & EBITDA(%) Particulars QoQ % YoY % Operating Revenue Other Income Total Revenue 2,004.46 106.52 2,110.98 1,986.34 44.60 2,030.94 1,938.03 56.15 1,994.18 2004 2004 0.91% 138.83% 3.94% 3.43% 89.71% 5.86% 1986 27.10 % 1938 25.40 % 25.40 % 26.00 % Less: Operating Cost 1,401.83 1,334.82 1,326.50 5.02% 5.68% Operating Profit Operating Profit % Employee Cost Admin Cost 709.15 33.6% 108.48 63.99 696.12 34.3% 93.00 52.96 667.68 33.5% 96.78 53.37 1.87% 6.21% Q2 FY 23 Q3 FY 23 Q3 FY 22 Q3 FY 23 16.65% 20.83% 12.09% 19.90% QoQ QoQ YoY YoY EBITDA EBITDA% Finance Cost Depreciation PBT 536.68 25.4% 15.76 139.63 381.29 550.16 27.1% 15.94 138.55 395.67 517.53 26.0% 15.22 140.17 362.14 -2.45% 3.70% Operating Cost Employee Cost Admin Cost Finance Cost Depreciation Tax Profit 66% 5% 3% 1% 7% 4.4% 13.7% -1.13% 0.78% -3.63% 3.55% -0.39% 5.29% Tax 92.99 99.81 85.79 -6.83% 8.39% PAT PAT % EPS 288.30 13.7% 4.82 295.86 14.6% 4.99 276.35 13.9% -2.56% 4.32% 4.65 -3.41% 3.66% @ 2 0 2 3 A M I C U S A D V I S O R S , C O N F I D E N T I A L
Container Corporation of India YOUR BUSINESS THINKTANK Management Comments Management Comments • So the overall margin figures have come down a little bit. But the good thing is domestic growth is continuously there as we’ve seen last year, 30% plus growth. • In the next four years, we are expecting lot of growth in domestic. And the important part which we all of us here should note, the domestic revenues which used to be 20% of total revenues in the year 2015-2016 and that was traditional 80:20 mix of the total revenue, and today it has come in this quarter to 65:35, and it will further grow. • We already crossed 3,000 double-stack trains in this year for the nine months, and this year, we are expecting to cross more than 4,000 trains. It’s a record. • So the market share in EXIM, we lost around 4%. It was 62.7%, it has come down to 58.3% when I look at all. • Domestic margins, we work around 18%, and in EXIM, we work with the margins of almost 26%. @ 2 0 2 3 A M I C U S A D V I S O R S , C O N F I D E N T I A L
Container Corporation of India YOUR BUSINESS THINKTANK • An Indian public sector undertaking, engaged in transportation and handling of containers, that came into existence in 1988. • The company is currently under consideration for privatization, which involves Government of India selling 30% out of its 54% holding. • The formation of COCOR relieved the Indian railways of its inland container depots (ICDs). Particulars Market Cap as on 31 Dec 2022 (in Cr) 45,015 PE Ratio 39 Return on Capital Employed 9.7% Domestic Services Domestic Services The company has 22 exclusive domestic terminals. In domestic service, CONCOR’s fleet has an approximate TEU of 20,000. While most of these are owned, some of them are also brought on lease basis. The company also has different types of special containers like Open Top, Side Doors, Tanks Ventilated, etc. DSO (as on 31.3.2022) 9 Sales (as on 31.3.2022) 7,653 Account Receivable (as on 31.3.2022) 182 Financial performance In FY 2021-22, the company had a PE Ratio of 38.54. Income from operations which increased by 18.9% in this FY was majorly because of EXIM segment. The increase in revenue was mainly on account of increase in revenue from rail freight, road freight, warehousing income and other operating income. Operating Profit (%) 33.6% EBITDA Margin (%) 25.4% PAT Margin (%) 13.7% @ 2 0 2 3 A M I C U S A D V I S O R S , C O N F I D E N T I A L
Gateway Distriparks YOUR BUSINESS THINKTANK Amt in Cr Revenue & EBITDA(%) Q3 FY23 Dec-22 Q2 FY23 Sep-22 359.13 Q3 FY22 Dec-21 349.27 Particulars QoQ % YoY % 359 28.20 % Operating Revenue Other Income Total Revenue Less: Operating Cost Operating Profit Operating Profit (%) Employee Cost Admin Cost EBITDA EBITDA% Finance Cost Depreciation Exceptional Items & Profit of JV & Associate PBT Tax PAT PAT % EPS 341.08 2.87 343.95 206.79 137.16 39.9% 17.44 25.91 93.81 27.3% 10.52 25.86 -5.03% -2.34% 27.30 % 27.30 % 2.77 6.76 3.61% -57.54% 27.30 % 349 361.90 224.57 137.33 37.9% 15.68 22.97 98.68 27.3% 11.27 26.66 356.03 216.20 139.83 39.3% 15.18 24.41 100.24 28.2% 16.11 33.43 -4.96% -3.39% 341 341 -7.92% -4.35% -0.12% -1.91% 11.22% 14.89% Q2 FY 23 Q3 FY 23 Q3 FY 22 Q3 FY 23 12.80% 6.15% QoQ QoQ YoY YoY -4.94% -6.41% -6.65% -34.70% Operating Cost Employee Cost Admin Cost Finance Cost Depreciation Tax Profit 60% 5% 8% 3% 8% 1.0% 16.1% -3.00% -22.64% 1.50 1.07 0.36 58.93 3.61 55.32 16.1% 1.11 61.82 2.28 59.54 16.5% 1.19 51.06 3.13 47.93 13.5% 0.96 -4.67% 15.41% 58.33% 15.34% -7.09% 15.42% -6.72% 15.63% @ 2 0 2 3 A M I C U S A D V I S O R S , C O N F I D E N T I A L
Gateway Distriparks YOUR BUSINESS THINKTANK Management Comments Management Comments • Due to the global macroeconomic situation, there is a dip in throughput in Q3 particularly in the export direction. • Track upgradation work was taking place in NCR throughout the month of December, leading to slower running of trains and reduced double stack and hub and spoke operations of the company • The construction at the proposed inland container depot in Jaipur remains in progress and the terminal is expected to be operational in the third quarter of next fiscal • So overall, also, if you look at our market share, it’s grown on a nine-month compared to nine-month basis. NCI were at about 16%. And I think we used to be at 12% about a year, year-and-half ago. @ 2 0 2 3 A M I C U S A D V I S O R S , C O N F I D E N T I A L
Gateway Distriparks YOUR BUSINESS THINKTANK Particulars Gateway Distriparks is an integrated inter-modal logistics service provider. It has a network of 9 Inland Container Depots and Container Freight Stations s trategically located across the country, operating a fleet of 31 trainsets along with 500+ trailers for transportation between its facilities and maritime ports, as well as first & last mile connectivity to provide end to end solutions to the EXIM industry. Market Cap as on 31 Dec 2022 (in Cr) 3,388 PE Ratio 13.31 Return on Capital Employed 12.2% DSO (as on 31.3.2022) 31 Rail Transportation Rail Transportation • Operating 31 Rakes – 21 Owned & 10 on long term Lease • Regular services between JNPT, Mundra, Pipavav and hinterland ICDs in North India Sales (as on 31.3.2022) 1,360 Account Receivable (as on 31.3.2022) 117 ICD/CFS ICD/CFS Operating Profit (%) 39.9% Warehousing Warehousing Road Transportation Road Transportation EBITDA Margin (%) 27.3% PAT Margin (%) 16.1% @ 2 0 2 3 A M I C U S A D V I S O R S , C O N F I D E N T I A L
Snowman Logistics YOUR BUSINESS THINKTANK Amt in Cr Q3 FY23 Dec-22 Q2 FY23 Sep-22 108.62 Q3 FY22 Dec-21 73.40 Revenue & EBITDA(%) Particulars QoQ % YoY % Operating Revenue 109.39 0.71% 49.03% 110 109 110 Other Income 1.42 1.03 1.15 37.86% 23.48% 26.00 % 73 Total Revenue 110.81 109.65 74.55 1.06% 48.64% Less: Operating Cost 65.54 65.65 37.87 -0.17% 73.07% 22.70 % 22.70 % Operating Profit Operating Profit(%) Employee Cost 45.27 40.9% 9.67 44.00 40.1% 8.28 36.68 49.2% 6.21 2.89% 23.42% 22.00 % Q2 FY 23 Q3 FY 23 Q3 FY 22 Q3 FY 23 16.79% 55.72% QoQ QoQ YoY YoY Admin Cost 10.45 11.61 11.07 -9.99% -5.60% EBITDA EBITDA% Finance Cost 25.15 22.7% 5.63 24.11 22.0% 5.69 19.40 26.0% 4.83 4.31% 29.64% Operating Cost Employee Cost Admin Cost Finance Cost Depreciation Tax Profit 59% 9% 9% 5% 12% 2.3% 3.4% -1.05% 16.56% Depreciation 13.21 13.26 13.52 -0.38% -2.29% PBT 6.31 5.16 1.05 22.29% 500.95% Tax 2.57 2.49 0.23 3.21% 1017.63% PAT PAT % EPS 3.74 3.4% 0.22 2.67 2.4% 0.16 0.82 1.1% 0.05 40.07% 356.07% 37.50% 340.00% @ 2 0 2 3 A M I C U S A D V I S O R S , C O N F I D E N T I A L
Snowman Logistics YOUR BUSINESS THINKTANK Management Comments Management Comments • We expect to continue the momentum and grow from here. Our efforts towards offering services and solutions to complex and challenging operations are gaining traction and we hope to add some new businesses to our kitty soon • The new distribution model that we had started in the previous quarter has worked out well and is also helping increase the throughput of both our storage and transportation verticals. • We are setting up a best-in-class chemical handling warehouse, which is around 55,000 square feet warehouse in Shoolagiri near Bangalore. We are expecting around INR12 crore of top line per annum from this business with a 12% margin • So last year, overall, we have — if we compare Q-on-Q, we have a 7% price increase, ASP increase, average sales price increase over last year same quarter. @ 2 0 2 3 A M I C U S A D V I S O R S , C O N F I D E N T I A L
Snowman Logistics YOUR BUSINESS THINKTANK Snowman Logistics is engaged in the business of Temperature controlled logistics including, but not limited to storage, transportation by road, and distribution of products requiring a temperature controlled environment. Particulars Market Cap as on 31 Dec 2022 (in Cr) 633 Transportation Facilities (60%) Transportation Facilities (60%):In Q3 FY23, the Co. had a total of ~523 vehicles, out of which 86 are dedicated vehicles, ~200 are vehicles on need basis and 237 are owned vehicles PE Ratio 78.96 Return on Capital Employed 2.7% Warehousing Capacity (40%): Warehousing Capacity (40%): The company has 43 temperature-controlled warehouses located across 17 cities near to various major ports and major consuming cities in India with a 130k pallet capacity DSO (as on 31.3.2022) 86 Sales (as on 31.3.2022) 286 Industry Wise Industry Wise Dairy & Ice-cream - 32% QSR & RTC - 21% Meat, Seafood & Poultry - 19% Agriculture - 9% FMCG & Others - 10% Healthcare & Pharma - 5% E-Commerce - 4% Focus Focus The Co. continues to focus on offering faster turnaround time for client-centric solutions, expanding geographies at major manufacturing & consumer hubs and to provide additional value-add services. Account Receivable (as on 31.3.2022) 67 Operating Profit (%) 40.9% EBITDA Margin (%) 22.7% PAT Margin (%) 3.4% @ 2 0 2 3 A M I C U S A D V I S O R S , C O N F I D E N T I A L