Download
1 / 16
160 likes | 214 Views
Introduction to statistics. Averages and variances. Statistical independence. Frequency P. 1. 2. 3. 4. 5. 6. x (# dots). Distributions. 25. 23. 22. 15. 0.25. Frequency P. 0.23. 0.22. 8. 5. 0.15. 0.08. 1. 2. 3. 4. 5. 6. 0.05. x (# dots). Statistics. 0.25.

E N D
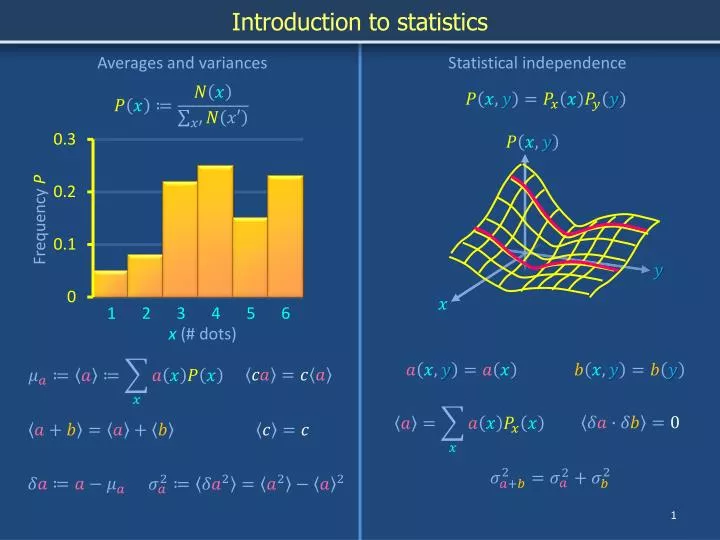
Introduction to statistics Averages and variances Statistical independence Frequency P 1 2 3 4 5 6 x (# dots)
Distributions 25 23 22 15 0.25 Frequency P 0.23 0.22 8 5 0.15 0.08 1 2 3 4 5 6 0.05 x (# dots)
Statistics 0.25 Frequency P 0.23 0.22 0.15 0.08 1 2 3 4 5 6 0.05 x (# dots)
Central tendency Average 0.25 Frequency P 0.23 0.22 0.15 0.08 1 2 3 4 5 6 0.05 x (# dots)
Identities involving averages Average Average of sum 0.25 Frequency P 0.23 0.22 0.15 0.08 1 2 3 4 5 6 0.05 x (# dots)
Identities involving averages Average Average of sum 0.25 Frequency P 0.23 0.22 0.15 0.08 1 2 3 4 5 6 0.05 x (# dots)
Identities involving averages Average Average of sum 0.25 Frequency P 0.23 0.22 0.15 0.08 1 2 3 4 5 6 0.05 x (# dots)
Identities involving averages Average Average of sum 0.25 Frequency P 0.23 0.22 0.15 0.08 1 2 3 4 5 6 0.05 x (# dots)
Identities involving averages Average Average of sum 0.25 Frequency P 0.23 0.22 Average of constant times function 0.15 0.08 1 2 3 4 5 6 0.05 x (# dots) Average of constant
Dispersion Average Deviation (from average) 0.25 Frequency P 0.23 0.22 0.15 Cancellation can happen between positive and negative deviations 0.08 1 2 3 4 5 6 0.05 Variance x (# dots) Squared deviations are never negative, so no cancellation “Computing formula”
Introduction to statistics Averages and variances Statistical independence Frequency P 1 2 3 4 5 6 x (# dots)
Statistical independence # of instances Frequency P (# dots on 2nd die) 1 2 3 4 5 6 x (# dots) (# dots on 1st die) Simple: Variation with y independent of x
Statistical independence (# dots on 2nd die) (# dots on 1st die) Simple: Variation with y independent of x
Identities following from statistical independence Average of function of a single variable 1
Identities following from statistical independence Average of function of a single variable Covariance of independent functions