Download
1 / 3
30 likes | 152 Views
TNF -α and GDM. Fig 5. Funnel plot showing the association between Standard Error of mean difference [ SE(MD) ] and mean difference ( MD ) as it was calculated by the fixed effect model. Leptin and GDM.

E N D
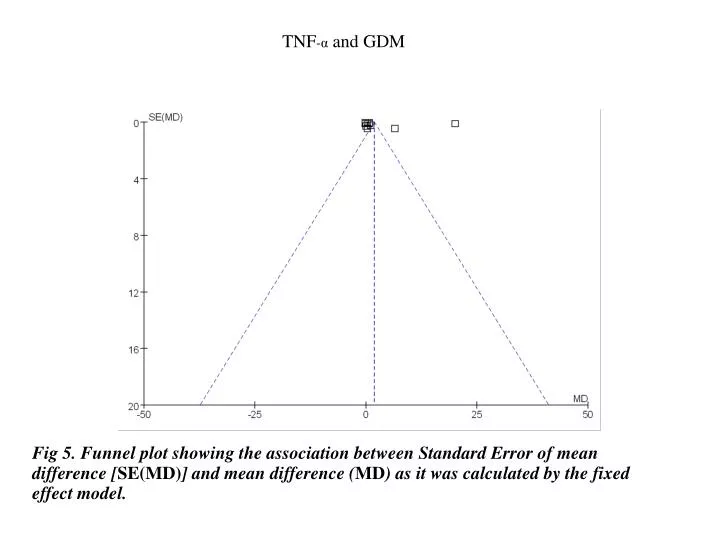
TNF-α and GDM Fig 5. Funnel plot showing the association between Standard Error of mean difference [SE(MD)] and mean difference (MD) as it was calculated by the fixed effect model.
Leptin and GDM Fig 6. Funnel plot showing the association between Standard Error of mean difference [SE(MD)] and mean difference (MD) as it was calculated by the fixed effect model.
Adiponectin and GDM Fig 7. Funnel plot showing the association between Standard Error of mean difference [SE(MD)] and mean difference (MD) as it was calculated by the fixed effect model.