Download
1 / 25
250 likes | 399 Views
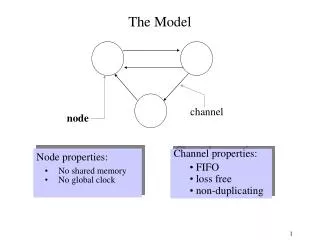
The CIS Model. Research, Rationale, & a Business Plan. CIS Mission. To Champion the Connection of Needed Community Resources with Schools to Help Young People Successfully Learn, Stay in School and Prepare for Life. CIS Network Theory of Change. Strategy. CIS Model. Outcomes. Impact.

E N D
The CIS Model Research, Rationale, & a Business Plan
CIS Mission • To Champion the Connection of Needed Community Resources with Schools to Help Young People Successfully Learn, Stay in School and Prepare for Life.
CIS Network Theory of Change Strategy CIS Model Outcomes Impact Supports And Convenes Key Stakeholders (Power, Authority, Community) CIS Network Widely accessible prevention and intervention services Positive outcomes for school Coordinate services and resources in public school setting guided by the “Five Basics” Permanent institutional change The CIS Model Appropriately balanced and integrated for maximum effectiveness Evidence-Based Integrated Student Services based on assessed student and school needs Significant reduction in dropout rates Sustainable nonprofit organizations with expertise in providing integrated students support services Targeted and sustained individual student interventions Positive student outcomes
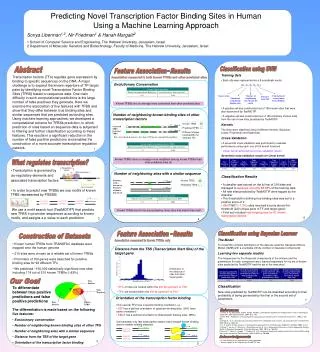
Connect Level I Services to Address School-wide Needs Monitor and Adjust Services Evaluate Effectiveness at Achieving School Goals Annual Needs Assessment Annual Site Operations Planning CIS Site Team Annual Reporting Connect Level II Services Based on Individual Plans for Students with Greatest Needs Evaluate Effectiveness at Achieving Individualized Goals Monitor and Adjust Services The CIS Model
Key Components of the CIS Model • Site Coordinator • Community, School, and Student Assessments • Service Plan • Effective Prevention & Intervention Strategies • Evaluation and Refinement
Why do we need Integrated Student Services? “The Greatest Proximate Cause [for why a school becomes a dropout factory] is that there is a fundamental Miss-Match between the Number of Students in Need of Academic and Social Supports in a High School and the Human Resources and Know How Available to Help” (Source: Balfanz & Legters, 2007)
Site Coordinator: “Know How” In Action • Providing site leadership and service providers with a single contact person • Planning and fully Implementing CIS model • Coordinating implementation of annual site operations plan in partnership with site • Ensure needs assessment, service delivery, data tracking and evaluation/reporting take place at site • Manage Level 2 Services for at least 10% of students • Manage service providers at site • Enhancing quality control of services provided on behalf of CIS
National Dropout Prevention Center Student Assessment Research: Off the Path to Graduation National Dropout Prevention Center: “Dropping out of school is the result of a long process of disengagement that may begin before a child enters school.”
Student Assessment: Where Students Stray from the Path to Graduation Poor prior preparation; lack of success in academic coursework Low motivation and engagement in middle and high school • Poor attendance in middle and high school • Neighborhood high schools that are under-resourced to meet student needs: • High Rates of Course Failure Low Promotion Rates Repeaters Dropouts (Source: Balfanz & Legters, 2007)
Using Assessment to Guide Planning • Identify Gaps and prioritize overall student needs to illuminate where CIS should cultivate comprehensive plans. • Gather human and financial resources needed for a sustained campaign • Develop plan to focus community and school resources on transition points where students fall off path to graduation (Adapted from Balfanz & Legters, 2007)
National Dropout Prevention Center NDPC Evidence Based Practices: From Assessing Risk to Delivering Services • Students in at-risk situations can be identified. • Risk Factors can be isolated and identified. • Evidenced-based programs are available and can address these Risk Factors. • Effectiveness of these programs with all students can be measured.
Assessing Student Risk Factors Individual background characteristics (having a disability) Early adult responsibilities (working to support family) Social attitudes, values and behavior (having a high-risk peer group or negative attitudes about school) School performance (low achievement) School engagement (poor attendance) School behavior (frequent disciplinary referrals) National Dropout Prevention Center 12
Assessing Family Risk Factors Family background characteristics (poverty) Family engagement/commitment to education (low educational standards) Lack of conversations about school National Dropout Prevention Center 13
Service Plan: Effective Prevention, Intervention, and Recovery Efforts • Comprehensive Blueprint for focusing site staff on achieving identified goals through evidence-based practices • Alignment: Ensures that CIS services are meeting pre-determined goals and objectives • Effective: Can increase graduation rates by about 10% at each transition; focusing on one transition has some effect but is not sufficient (range from pre-K to 12). (Adapted from Balfanz & Legters, 2007)
Multi-Tier Model(Source: Center for Social Organization of Schools, Johns Hopkins University)
CIS Model: Mix of Effective Prevention & Intervention Strategies Level One Services: Widely-accessible prevention and asset-building services provided as part of a coordinated plan to address identified school-wide needs. Level Two Services: Targeted and sustained intervention and prevention services provided for students experiencing dropout risk factors; delivered as part of Individualized Student Plans with clearly defined goals. 16
Level 2 Services: Individualized Student Plan (ISP) Background: Basic demographic information Assessment: Assessed risk factors Outcome-Focused: Individualized goals/ objectives Services and resources to be provided Timeline for Providing and Monitoring services or resources 17
What do our Network Evaluation findings say about the CIS Model’s impact on Dropout Prevention? • CIS is one of a small number of dropout prevention programs proven to keep kids in school.
What do our Network Evaluation findings say about the CIS Model’s impact on Graduation Rates? • CIS is the only dropout prevention program in the nation proven to increase graduation rates, graduating students on time with a regular diploma.
What do our Network Evaluation findings say about how the CIS Model compares to non-integrated approaches? • The CIS Model for integrated student support services correlates more strongly with school level outcomes than service provided without integrated student supports.
What do our Network Evaluation findings say about the CIS Model’s impact on Math and Reading Proficiency? • When implemented with fidelity, the CIS Model results in a higher percentage of students reaching proficiency in 4th and 8th grade math and in 4th and 8th grade reading.
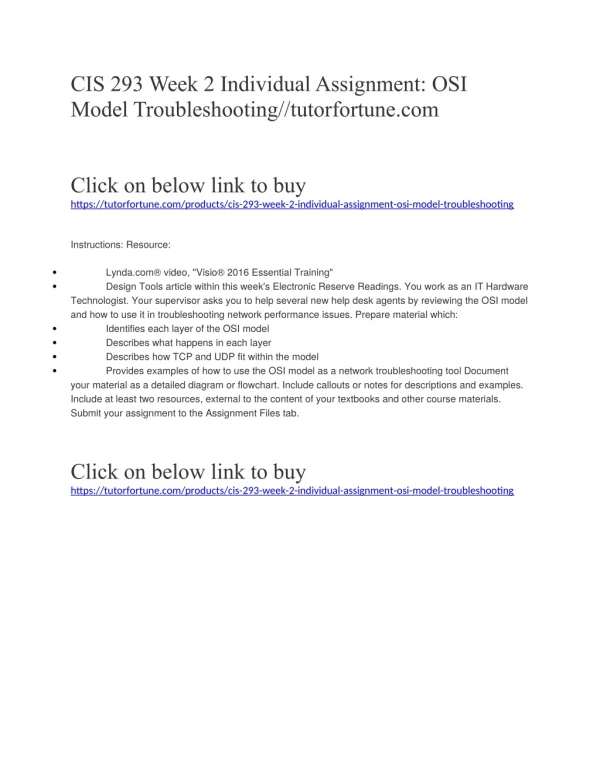
Interpreting Percentage Differences in Outcomes Two U.S. Dept. of Education indicators interpret the magnitude of the net difference between study and control groups • Effect Size • Translates the difference in outcomes between study and control groups to a common scale • Defines an effect size of .25 or higher as meaningful • Improvement Index • Translates the effect size into the predicted percentile rank improvement of a student or school for that outcome • For example, a .25 effect size in reading proficiency would translate to a 10 percent improvement in a student or school’s percentile rank in reading
Relationship Between Control Group and Study Group Means Control Group Mean Study Group Mean 10% Effect Size = .25 Improvement Index = +10