Download
1 / 38
410 likes | 634 Views
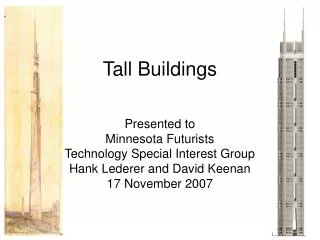
Tall Buildings Initiative Summary of Case Studies. Farzin Zareian University of California, Irvine. Quake Summit 2010 San Francisco, Oct 8, 2010. Collaborators. Jack Moehle , Yousef Bozorgnia . UCB John Wallace, Zeynep Tuna. UCLA Tony Yang. UBC Pierson Jones. UCI Nilesh Shome . RMS

E N D
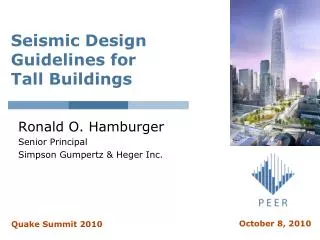
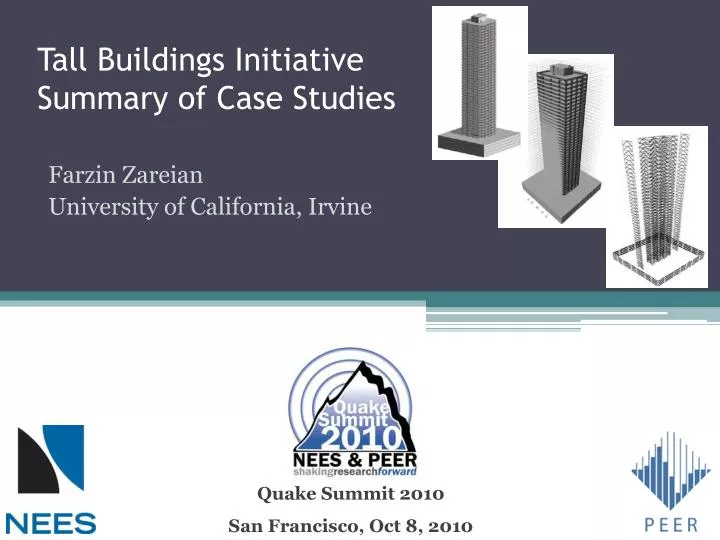
Tall Buildings InitiativeSummary of Case Studies Farzin Zareian University of California, Irvine Quake Summit 2010 San Francisco, Oct 8, 2010
Collaborators Jack Moehle, YousefBozorgnia. UCB John Wallace, Zeynep Tuna. UCLA Tony Yang. UBC Pierson Jones. UCI NileshShome. RMS Paul Somerville. URS
Sponsors California Seismic Safety Commission California Office of Emergency Services (CalEMA) FEMA City of Los Angeles
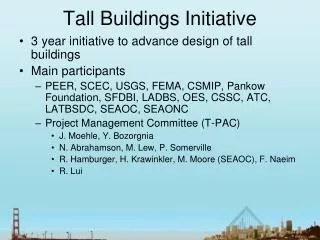
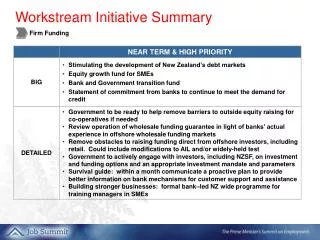
Objective and Scope • Assess the performance of designed tall buildings using latest technology • Development of earthquake ground motions for design studies. • Development of building analytical models • Conduct a large number of earthquake simulations of tall buildings to develop statistics of engineering demand parameters • Perform loss estimation for designed buildings • Few side studies: simulated vs recorded motions, effect of vertical component of ground motion, etc.
Sierra Madre (San Fernando) San Andreas Sierra Madre (Cucamonga) Verdugo Raymond Santa Monica Hollywood Elsinore (Whittier) 1.5Km, Puente Hills 7.3Km, Hollywood 8.8Km, Raymond Elsinore (Chino) Newport-Inglewood-Rose Canyon 11.5Km, Santa Monica 24.5Km, Elsinore 40.0Km, Sierra Madre 56Km, San Andreas
Challenges in Ground Motion Selection • Significance of several modes of vibration in response of the building. • Similar ground motions for all structures. • Five hazard levels needs to be looked at: (SLE-25, SLE-43, DBE, MCE, OVE) • A large number of motions are required (we used 15) to have a reasonable estimate of the dispersion in EDP.
Record Selection and Scaling • Scaling : • Maximum acceptable scale factor = 5.0 • The scale factor, by which the smallest weighted error between the target spectrum and the geometric mean spectrum of a single recording is acquired, is computed. • Records are matched between Tmin&Tmax at 0.5 & 10.0 sec. Uniform Error Weight Variable 26% %42 32% 10% %60 30% 0.5 3.0 7.0 Period
Response Spectra OVE (4975 year) 7 unscaled pairs are from simulated motions (URS/SCEC)
Response Spectra OVE (4975 year) Rec Sim Med Target Sa(T) Period
Building Design and Modeling • Three Building Systems • After: Zeynep Tuna
42-Story Concrete Core Wall • General Modeling Assumptions • 3D nonlinear dynamic finite element model (Perform3D). • Ignored the gravity system. • Basement walls below grade were modeled using elastic shear wall elements (Eeff = 0.8 E) • Slabs below grade were modeled using elastic shear shell element (Eeff = 0.25 E)
42-Story Concrete Core Wall • Building Design Comparison 1B: PBEE 1A: Code 1C: PBEE+ 32” 32” 24” 24” 28” 28” Wall: Strong Stronger Strongest Coupling beam: Stronger Stronger Strong T1EW= 4.8 sec T1EW= 4.6 sec T1EW= 5.2 sec 1st mode Period: T1NS= 3.6 sec T1NS= 3.5 sec T1NS= 4.0 sec • After: Tony Yang
42-Story Concrete Core Wall • Structural design: • Wall thickness: • Wall vertical reinforcement: • Coupling beam reinforcement: • Structural period: • Structural response: • Wall stress safety index: • Coupling beam demand: • Inter-story drift and wall edge strain: 1A < 1B < 1C 1A < 1B < 1C 1C < 1A ~ 1B 1C < 1B < 1A 1B < 1A < 1C 1A < 1B < 1C 1C < 1B < 1A • After: Tony Yang
Building Design and Modeling • Three Building Systems • After: Zeynep Tuna
42-Story Concrete Dual System • General Modeling Assumptions • 3D nonlinear dynamic finite element model (Perform3D). • Ignored the gravity system. • Basement walls below grade were modeled using elastic shear wall elements (Eeff = 0.8 E) • Slabs below grade were modeled using elastic shear shell element (Eeff = 0.25 E)
42-Story Concrete Dual System • Building Design Comparison 2B: PBEE 1C: PBEE+ 2A: Code Columns: Columns: 16” 18” 36 X 36 36 X 36 18” 42 X 42 42 X 42 24” 24” 46 X 46 46 X 46 Wall: Strongest Strong Coupling beam: Strong Strong T1EW= 4.3 sec T1EW= 4.5 sec 1st mode Period: T1NS= 3.9sec T1NS= 4.0 sec
Building 2A – Inter-story drifts in H1 direction 42-Story Concrete Dual System
Building 2B – Inter-story drifts in H1 direction 42-Story Concrete Dual System
42-Story Concrete Dual System • Inter-story drifts in H1 direction
42-Story Concrete Dual System Summary of findings • Overall behaviors of the two building designs are quite similar. • Median inter-story drift ratios (max ≈ 2%) are all well below established limits. • Wall shear stresses and strains are slightly higher in the code-based design. • Column axial forces in the code-based design are twice as high as those in the PBD.
Building Design and Modeling • Three Building Systems • After: Zeynep Tuna
40-Story Buckling Restrained B.F. • General View Bldg. 3A Bldg. 3B Bldg. 3C
40-Story Buckling Restrained B.F. • General Modeling Assumptions • PERFORM3D (version 4.03) structural analysis software by Computers and Structures Inc. was used for the nonlinear time history analysis. • The only nonlinear element employed in the model is the Buckling Restrained Brace element. (Ry = 1.1, ω = 1.25, and β = 1.1.) • The brace components in the model have a maximum deformation capacity of (20εy) • Gusset plate will have full ductility capacity. • No cyclic deterioration was modeled
Bldg. 3C Bldg. 3A Bldg. 3B KEY: BRB strength [Kips] 40-Story Buckling Restrained B.F. • Building Design Comparison 300K-500K 501K-800K 801K-1200K NOTE: GRID LINE 2&7 N-S DIRECTION T1NS= 5.7 sec T1NS= 5.3sec T1NS= 6.5 sec T1EW= 4.2 sec T1EW= 3.8 sec T1EW= 4.5 sec
Return Period E-W N-S Building 3A GM set 4975 (years) OVE 2475 (years) MCE 475 (years) DBE 43 (years) SLE43 median %16th and %84th Individual earthquake 25 (years) SLE25 N-S E-W MAXIMUM IDR
Return Period E-W N-S GM set 4975 (years) OVE 2475 (years) MCE 475 (years) DBE N-S E-W 43 (years) SLE43 median %16th and %84th Individual earthquake 25 (years) SLE25 MAXIMUM IDR Building 3B
Return Period E-W N-S GM set 4975 (years) OVE 2475 (years) MCE 475 (years) DBE N-S E-W 43 (years) SLE43 median %16th and %84th Individual earthquake 25 (years) SLE25 MAXIMUM IDR Building 3C
40-Story Buckling Restrained B.F. %Exceedance Of 3% Drift Ratio 25% 20% 15% 10% 5% 0% • Safe maximum IDR considered to be IDR=.03 • There were no component failures for the BRBF lateral load system $249/SF $256/SF $245/SF OVE MCE DBE SLE43 SLE25 • Building 3C did not exceed the safe IDR in any of the ground motions, was considered to perform the best. • Building 3A generally performed better than the performance based design (Building 3B)
Based on inter-story drift and floor acceleration results only. • Similar components in all buildings. • The EDPs from nonlinear time-history analysis are used directly for loss calculations without any fitting as done commonly for loss estimations. Basic Assumptions for Loss Calculations
General Summary • Performance of 9 tall buildings at five hazard levels were evaluated: Three lateral load resisting systems X Three design guidelines. • The progress in reduction in estimated loss from CBD to PBD+ designs shows the a general success in proposed design guidelines for tall buildings. • On going efforts: • Loss estimation methodology