Download
1 / 44
440 likes | 635 Views
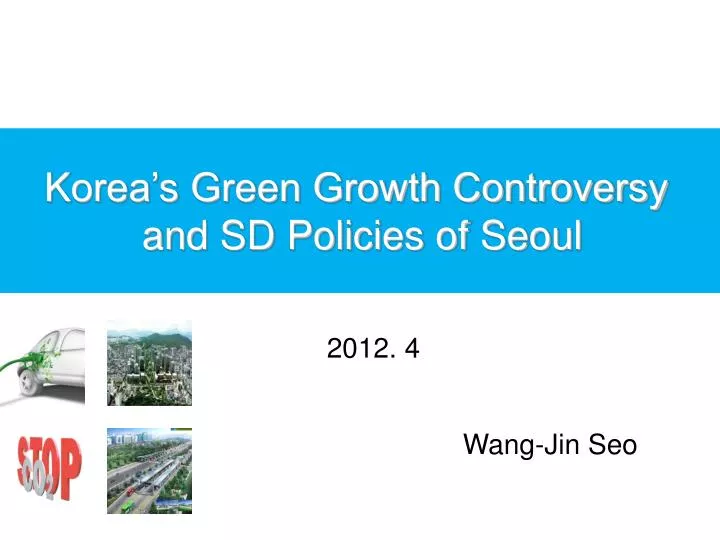
Korea’s Green Growth Controversy and SD Policies of Seoul. 2012. 4. Wang-Jin Seo. Contents. Sustainable Development (SD) and. Green Growth in Korea. Green Growth Controversy in Korea. Seoul’s Challenges toward SD. Seoul’s Climate Change Action. Seoul’s Sustainable Energy Action:.

E N D
Korea’s Green Growth Controversy and SD Policies of Seoul 2012. 4 Wang-Jin Seo
Contents Sustainable Development (SD) and Green Growth in Korea Green Growth Controversy in Korea Seoul’s Challenges toward SD Seoul’s Climate Change Action Seoul’s Sustainable Energy Action: “Shut Down One Nuclear Power Plant”
From SD to Green Growth in Korea • Participation into the UNCED in Rio (1992) • Participation into UNCSD annually since 1993 • Establishment of ‘Local Agenda 21’ by Local Governments in accordance with the ‘Agenda 21’ recommendations • President Kim Dae-jung announced ‘Sustainable Development’ as the basis of national governance (2000) • ‘Presidential Commission on Sustainable Development (PCSD)’ in which government, businesses and civil groups participate organized (2000)
From SD to Green Growth in Korea President Roh Moo-hyun reorganized PCSD focusing on resolution of social and environmental conflicts (2003) Establishment of the Framework Act on Sustainable Development (2007) President Lee Myung-bak from Grand National Party, a conservative party won presidential election in 2007 Lee Myung-bak administration declared ‘Low Carbon, Green Growth’ as a new vision and strategy for realization of ‘Sustainable Development’ (2008) 5
VISION 비전 One of the World’s Top 7 Green Superpowers by 2020 (top 5 by 2050) Climate change adaptation and energy independence Creation of new growth engine 4 1 8 5 9 2 10 3 7 6 Infrastructure development for green economy Efficient greenhouse gas reduction Green innovation in daily lives Realization of global green growth leader Construction of green land & transportation Vision of Low-carbon Green Growth Improvement of quality of life Green technology development Top Three Strategies and Top 10 Policy Directions Fostering green industry Promotion of energy independence Advancement of industrial structure Improvement of climate change adaptation capacity
1 Afforesting sea forest development Support on forest recovery in North Korea Top 5 Policy Directions and Promotion Plans Efficient greenhouse gas reduction Nation’s GHG reduction goal setting and management Carbon information disclosure and management • (’09) Mid-term goal setting→(’10~)Goal management • GHG information management system GHG Financial investment plan(KRW trillion) Job creation (x 10,000 jobs) Growth rate 6.5% 2.5 • Experts such as greenhouse gas inspection & certification expert • green consultant 2.1 7.8 1.0 ’09~’13 ‘09 ’10~ ‘11 ’12~‘13 Promotion of carbon cycle (Carbon-3R) and carbon sink • North Korea’s afforestation area: (’09) 50,000 ha (’13) • Carbon storage of the forest: (’09)1,452 (’13)1,613 million tCO2
Enhancing Energy independence Energy efficiency and demand side management Improvement of reliability and expansion of nuclear power plant 2 wind power generation solar thermal green home fuel cell 3.6% Promotion of industrialization of new & renewable energy • New & renewable energy use rate: (’09)2.%, (’13)3.8% • Green Home Project : 140,000 households(2013)→1M households (2020) • Energy Town Project: 1 (2009) 14 towns (2020) • Elimination of low-efficiency equipment: • No more incandescent lamp by 2013 • Total energy use management system(’10) • Expansion of intelligent electricity network: • Designation of test-bed city (2011) Financial investment plan (KRW trillion) Job creation (x 10,000 jobs) • Waste resources energy development engineers • nuclear power generation engineers • resources development & support engineers Growth rate 6.5 5.6 20.8 2.8 ’09~’13 ‘09 ’10~ ‘11 ’12~‘13 Expansion of overseas resources development • Oil & gas self-development rates • : 7.4% (2009) 20% (2013) • Export of the first nuclear power plant during • the project period (1 or 2 plant(s) or more) • Development of nuclear power technology (2012)
Improvement of climate change adaptation capacity The Four Major Rivers Restoration Project • The amount of water resources secured :(’09)186 (’13)200billion m2 • Quality of four major rivers: 2nd grade by 2012 3 improvement of water quality securing sufficient water Development of climate change monitoring & prediction technique 20.4% Establishment of climate-friendly health management & food production system Development of marine management & preliminary disaster prevention system • Evaluation of coastal vulnerability: (’09) (’13)800km2 • Disaster response capability: (’09)40% (’13)60% use of marine energy disaster prevention Financial investment plan (KRW trillion) Job creation (x 10,000 jobs) 21.3 Growth rate • Climate change adaptation • expertswater industry engineers • Climate change prediction & monitoring capacity:(’09)40% (’13)80% 10.1 50.6 4.8 ’09~’13 ‘09 ’10~‘11 ’12~‘13 Improvement of the soundness of forest ecosystem • National forest resources: 862 • million (2009) 953 million㎥ (2013) • Health management strategy (2009) • Environment-friendly agricultural products: 4.5% (2009) 10% (2013)
Development of green technology as a growth engine Expansion of green R&D investments • Increase of green technology R&D investments: (2009) 16% (2013) 20% Commercialization of core green technologies • Commercialization of LED, hybrid vehicle, advanced light-water reactor and fuel cell by 2012 4 5.1% Expansion of green technology & infrastructure Improvement of Green IT: Green of IT, Green by IT • Development & export of • the world’s top three green • IT products (Green PC, TV • and Server) (2012) Financial investment plan (KRW trillion) Job creation (x 10,000 jobs) • Plant engineering, technology commercialization & manufacturing, facilities & construction workers 5.0 Growth rate 4.3 9.4 2.0 ’09~’13 ‘09 ’10~‘11 ’12~‘13 “Green TCS* System” Fostering green technology experts and international cooperation • Establishment of world-class • green technology information system • Green technology engineers: 20,000 (2009) • 37,000 engineers (2013) • Establishment of East Asia Green • Technology Standard Council (2013) *TCS: Testing, Certification, Standard
Promotion and fostering of green industry Development of resources-recycling economy & promotion of urban mining Green partnership between enterprises – improvement of green capacity for small & mid-size enterprises Greening core industries and expansion of green business 5 GreenPartner 6.7% Expansion of green industrial complexes • No. of green industry complexes: 5(2009) 10(2013)(Waste recycling, high-efficiency facilities & equipment, IT-based management system, etc.) • No. of businesses participating in the • green partnership : 685(2009) 1,500(2013) Financial investment plan (KRW trillion) Job creation (x 10,000 jobs) • Green diagnosis consultant • green growth expert for small & mid-sized enterprise Growth rate 2.0 1.8 4.9 0.8 ’09~’13 ‘09 ’10~‘11 ’12~‘13 • Greening core nine industries (petrochemical, steel, etc.) • Percentage of green export: 10% (2009) 15% (2013) • Resource recycling rates: 15% (2009) 17% (2013) • Support on urban mining-related R&D: KRW 9 billion (2009) KRW 37.5 billion (2013)
Low-carbon Green Growth and Nuclear Power Renaissance • Expansion of nuclear power generations • Percentage of nuclear power among total electricity: 35.5%(2007) 59.0%(2030)
Nuclear power-dependent structure • Aggressive nuclear power expansion policy • A total of 21 nuclear reactors in operation (2011) • 13 reactors to be constructed additionally by 2024 • Highest nuclear power density: 182.2kW/km2 (Japan: 127.2kW/km2) • Concentration of power generation facility investments in nuclear power plants
Ring of Nuclear and Korea • No. of nuclear reactors in China: 228 (13: In operation, 27: Under construction, 188: Under review for additional construction) • No. of nuclear reactors in Japan: 69 (construction plan included)
The Four Rivers Project • Goals • To secure abundant water resources against potential water scarcity; • To implement a comprehensive flood control system; • To improve water quality and restore the ecosystems; and • To create multi-use open spaces for People • Project scopes • Total 170 construction zones • 16 movable weirs • Dredging : total 450 million m3
98 250 46 (1960) (1980) (1990) (2010) (1975) (1980) (1990) (2010) (1960) (1980) (2000) (2010) City of Seoul is Capital of Korea for 600 years ; political, economic and cultural center Facing environmental problems caused by rapid urbanization such as increasing population, houses, and cars Affected by climate change challenges caused by intensifying global warming 1,062 1044 297 119 192 836 240 20.6 8.5 Population (10K) No. of houses (10K) No. of registered cars (10K)
Air Quality Seoul is surrounded by high mountains – difficult to diffuse air Affected by various air polluting factors such as increasing number of cars and yellow dust phenomenon Lower air pollution by implementing projects such as increasing use of clean fuel and promoting low pollution for diesel cars Sulfur dioxide (SO2), carbon monoxide (CO)level reached advanced nations’ level Particulate matter (PM10) level is higher than that of advanced nations Yellow Dust No. of monitored days PM10(㎍/㎥) 2,941 ㎍/㎥ 15 12 Max. Concentration ( ㎍/㎥) 12 11 11 9 1354 ㎍/㎥ 1157 ㎍/㎥ 6 5 1,355 ㎍/㎥ 1,059 ㎍/㎥ 623 ㎍/㎥ 511 ㎍/㎥ 2004 2005 2006 2007 2008 2009 2010 25 25
Green Park Green axis and forests are destroyed in the process of urbanization – house and road construction Expanded green space by increasing parks and green space continuously and conserving forests Not enough green parks in community area Park space per capita Parks in Seoul (2009) ㎡/capita Other Parks 18.61㎢ (11%) 29.7 30 24.5 24.2 Neighborhood Parks 45.52㎢ (27%) 20 16.05 Parks in Seoul 169.05㎢ Natural Parks 104.92㎢ (62%) 10.4 10.3 10 4.5 4.5 0 Toronto Berlin London Seoul Paris New York Tokyo Beijing 26 26
Greenhouse Gases GHG Emissions (’08) : Emissions in Seoul is 50,383K tonCO2e (1990 baseline year: emission44,983K tonCO2e), 5,400K tonCO2e (12.0%) increase compared to 1990 level 수송 (24.9%) 가정·상업 (56.7%) <GHG Emissions by Sector(`08)> Buildings and transportation account for more than 80% of GHG emissions in Seoul – Building: 61.4%, Transportation:21.4%, Industry:10.8%, Waste:6.4% * Buildings (68.2%) and transportation (23.6%) account for over 90% of annual energy consumption (45,761K ton CO2e)
Long term Climate Change & GHG Reduction Goals Set climate change visions for 2030 [Eco-Friendly Energy Declaration(‘07.4)set goals for2020] Announced 2030 Green Design Seoul(‘09.7) Set aggressive GHG reduction goals, similar to those of Annex 1 countries Provide visions for low carbon, low energy city, responding to climate change Seoul GHG reduction goal: 40% reduction by 2030(1990baseline year) Energy consumption: 20% reduction by 2030(2000baseline year) Renewable energy use: 20%increase by 2030 Reduce GHG emissions Reduce energy consumption Increaserenewable energy use 15% 20% 20% 25% 40% 10% 0.6% 2020 2030 2020 2030 2004 2020 2030 1990 Baseline yr 2000 Baseline yr 29
Set Climate Change Ordinance(‘08.9) Stipulate Seoul’s GHG reduction goals Apply Seoul Green Architecture Standard Lay foundation for management of Climate Change Fund ※ First regulation to be set in Korea without higher law • Climate Change Fund / Secured financing for stronger public support Increase financing: 64.8billion KRW (’09) ⇒ 93 billion KRW(’11) Expand beneficiary: Grant loans to GHG reduction and renewable energy projects Basic ground for implementation of comprehensive measures – climate change, energy, and transportation demand management 30
Set ground for climate change monitoring • Enhance capacity to address climate change AWS Automate weather monitoring system(’09. 1) : Install 26 AWS (Automatic Weather System) Produce Seoul Climate Change Map(’06~ ’08) Use as basic data to establish climate change plans and eco-friendly urban management policies Create emissions database – Seoul GHG inventory (’09) Update database & establish “GHG management system” (’11.5) • Build Climate Change R&D Center • (Seoul Development Institute,’09. 1) Enhance climate change and energy related research, improve policy development capacity 31
Implementation directions of climate change action plans Improve building energy efficiency, promote energy saving and eco-friendly design & maintenance Building Improve public transportation system, deliver eco-friendly green cars, install bicycle facilities Transportation Mitigation Save energy, use renewable energy, increase clean fuel and collective energy supply Energy Reduce waste generation, encourage recycling, co-use resource recovery facility Waste Improving Climate Greening projects, stream & ecosystem restoration projects Prepare for heat wave and tropical night phenomenon, prevent contagious diseases Public Healthcare Adaptation Water Management Water quantity and quality management, rainwater recycling Reinforce facilities to prepare for torrential rainfalls, prevent flooding Flood Control Citizen Participation Environmental education at homes & schools, encourage citizen participation programs – Eco-mileage, CAP, etc. Citizen Participation
Seoul’s Sustainable Energy Action:“Shut Down One Nuclear Power Plant” 33
Why ‘Shut Down One Nuclear Power Plant’? Low self-sufficiency rates (3.3%) Dramatic increase in demand for electricity Improvement of energy security to be prepared against electricity crisis Reduction of energy consumption as much as the amount of power produced by each nuclear power reactor through decrease in demand for energy and expansion of energy production Increase in citizens’ anxiety after Fukushima’s nuclear nightmare Necessary to prevent possible nuclear power accidents completely Necessary to reduce greenhouse gas emissions Severe climate changes such as global warming
Vision ‘Shut Down One Nuclear Power Plant’ Vision Establishment of the ground for energy independence targeting the world climate environmental capital - Power self-sufficiency rates: 10% (2014) 25% (2020) 2014 10% 2020 25% ‘Shut Down One Nuclear Power Plant’ Reduction of 2 million TOE by 2014 Goal Electricity 750,000 TOE (8,720GWh) Petroleum and city gas 1,250,000 TOE * The annual power generation of Yeonggwang Nuclear Power Plant Unit 5 (the biggest nuclear power reactor in Korea, 1GWh): 8,672GWh
Decrease in energy demand Energy production 610,000 TOE 1,390,000 TOE Electricity: 260,000 TOE (3,023GWh)) Heat: 350,000 TOE Elec.: 490,000 TOE (5,697GWh) Petroleum: 350,000 TOE City gas: 550,000 TOE Policies(77projects in six fields) promotion building energy efficiency establishing high-efficiency transportation system Expansion of new & renewable energy production creation of energy industry-related jobs restructure of urban space into energy-saving space creation of energy-saving citizens culture Goal Shut Down One Nuclear Power Plant
01 Construction of ‘Sunlight City (260MW)’ (the city itself is a huge PV power generation plant) Establishment and operation of energy foundation 04 03 05 Realization of ‘Smart Lighting City’ using LED (distribution of 7 million LED lights) Improvement of energy efficiency in residence, building and schools 100,000 people participating in the car-sharing program Establishment of ‘2030 Urban Master Plan’ for construction of energy- efficient urban space Strict design standards such as limit on energy consumption for new buildings Creation of 44,000 energy industry-related jobs 10 07 08 06 02 Construction of ‘Distributed Power System (320MW)’ through development of hydrogen fuel cell Creation of energy-saving citizens’ culture 09 Top 10 ‘Shut Down One Nuclear Power Plant’ projects
“We build a city which itself is a huge PV power generation plant.” – Sunlight City Expansion of the number of the PV Sunlight Power Generation Plants : 230MW by 2014 - 1,600 plants (ex: Public organizations, schools, etc.) : 130MW - 6,500 plants (ex: Residence, office buildings, etc.) : 100MW Construction of ‘Nanum Power Plant’ to go with a local society : 30MW by 2014 (26 plants in total) - Formation of local community or cooperatives - Use of the revenue on energy welfare Construction of energy self-sufficiency village : 25 villages by 2014 • Seongdaegol Village (Dongjak-gu), • Seongmisan Village (Mapo-gu), • Seowon Village (Gangdong-gu), etc Production and use of ‘Seoul Sunlight Map’ - Survey on PV potential and installation area Introduction of ‘Seoul Power Generation Financial Aid System’ to promote the distribution of small PV installations
“We dramatically enhance building energy efficiency.” * 2012 -→ 2014 BRP in high-energy-consumption mid-size and large buildings: 700 1,221 buildings Improvement of old and outdated public facilities Construction of low-carbon green schools 30 schools 1,221 building 842 buildings 700 building 10 schools 262 buildings BRP targeting 10,000 detached houses BRP (Municipal social welfare facilities) Eco-School (elementary, middle and high) Project 10,000 houses 59 facilities (completed 100%) 60 schools 30 facilities 30 schools 2,500 houses Home-visit energy diagnosis service: 50,000 households, 1,500 small buildings) X 50,000 X 1,500 Improvement of energy-saving systems such as insulated windows, LED lighting and heating & cooling system
“ We improve energy-saving systems such as insulated windows, LED lighting and heating & cooling system.” Expansion of the LED distribution in civil sector Construction of ‘Smart Lighting City’ through a perfect harmony between IT and lighting - Development of integrated outdoor lighting control system (ON-OFF, Dimming) - Establishment of ‘Outdoor Lighting Brightness Standards (2013)’: Underground parking lots of apartments and large commercial buildings: 2 million units Multipurpose facilities such as discount stores and departments stores: 5 million units LED Hall: Najin Store (2012 – 2015) Expansion of the LED distribution in publicsector : 815,000 units by 2014 Replacement of lighting sources (signboard, security lamp, street lamp, etc.) with high-efficiency ones Public buildings and road : 309,000 units Subway station (completed 100%) : 450,000 units Underground mall (completed 100%) : 16,000 units Replacement of old street lamps with energy-saving lamps: 140,000 16,500 LED security lamps in residence areas The number of LED and solar cell-used signboards: 3,000 annually - Expansion of the percentage of LED lighting For new buildings: 30-40% (2011) 100% (2014) Early distribution of LED lights by attracting private investments (investment first, revenue later) through LED Association
“We build environment-friendly, high-efficiency transportation system.” Promotion of ‘Weekly No Driving Day’ campaign in large buildings : 1,380 buildings (2012) 6,900 (2014) - 50% of the buildings which are subject to traffic occurrence charges (9% at present) Promotion of car-sharing program : 25,000 people (500 cars) (2012) 100,000 people (2,000 cars) - Priority on public parking lot ticket : 200 lots (2012) 1,200 lots (2014) - Operation of car-sharing information website and electric vehicle grant, etc. * Reduction of KRW 2,038,000 annually if a car-sharing program is used (SONATA 2.0 model / 10 years) Restriction on car use : Reduction of traffic volume : 8,260,000 cars (2009) 7,760,000 cars (2014) - Increase in traffic occurrence charges (KRW 350 1,000), increase in traffic occurrence indexes, expansion of local governor’s coordination rights (100% 200%),Increase in parking fee in urban & commercial area parking lots (2013) - Expansion and increase in congestion charges Purchase Passenger Car Maintenance Possession 2,850 2,100 1,908 KRW6,850,000 Basic Rate Annual Rate Car Sharing 110 4,701 KRW 4,812,000 Shift of perception from ‘possession’ to ‘use’ through the introduction of car-sharing program
Economic benefits: KRW 2.1 trillion • Petroleum import substitution: 15.6 million bl. • * Total project cost (KRW 3.4 trillion) will be fully collected by 2015. Effects Reduction of greenhouse gas emissions : 7,130,000 CO2 - 7,130km2afforestation effect: 1,584 times greater than Yeouido (4.5km) Energy savings :2 million TOE 2010 3.3% 2014 10% Job creation: 44,000 jobs Improvement of power self-sufficiency rates: 10% by 2014
One nuclear reactor will be shut down by 2014 2012 2013 2014 One nuclear reactor annually since 2015 2015 2016