Download
1 / 18
180 likes | 321 Views
Using CDAT for Model Intercomparison. Peter Caldwell Lawrence Livermore National Lab 1/27/11. UCRL: LLNL- PRES- 464775. Motivation. CDAT=Climate Data Analysis Toolbox. Challenges: Large datasets (need to be downloaded)

E N D
Using CDAT for Model Intercomparison Peter Caldwell Lawrence Livermore National Lab 1/27/11 Prepared by LLNL under Contract DE-AC52-07NA237344. UCRL: LLNL-PRES-464775
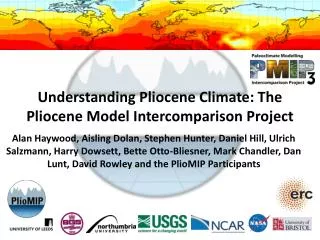
Motivation CDAT=Climate Data Analysis Toolbox Challenges: • Large datasets (need to be downloaded) • Inconsistent dataset properties (e.g. grids, time convention, file structure, variable names) • Processing and displaying data California-average wintertime rainfall from observations, reanalysis, regional models (RCMs) from the North American Regional Climate Change Assessment Program (NARCCAP), and global climate models (GCMs) from the Coupled Model Intercomparison Project Phase 3 (CMIP3)
Obtaining Data Climate analysis often requires downloading many large files. Doing this via GUI is miserable… but what choice do we have?
Obtaining Data – Option 1 • Python modules for batch downloading are available from some groups (e.g. ECMWF)… isn’t open source great? Initialize Loop over variables Download data
Obtaining Data – Option 2 • The cdms2 module of CDAT handles files on remote OPeNDAP servers as if they were local. see www2-pcmdi.llnl.gov/esg_data_portal/dapserver • network limits speed… use this to slice/download data, not for in-depth analysis. • OPeNDAP support must be turned on when CDAT is built • These nice options don’t always exist.
Standardizing File Structure - cdscan • Processing data spread over many files is a hassle. • Code that works across datasets with differing file structure is hard to write. • cdscan solves this issue by concatenating a list of files into a single xml file. • concatenation is virtual (via pointers) so xml files are very small. • Advanced options allow fixing bad original files. Example: datasets with differing file structure File 1 File 2 GCM1 File 3 File 1 File 2 GCM2 1970 1980 1990 2000 time (yrs) Creating an xml file: cdscan –x <output>.xml *.ncReading xml data: handle like a netcdf.
Reading data • cdat reads/writes netcdf and ascii easily • Can also read hdf, grib, binary, and other formats. (also see Mary Haley and Jeff Whitakers’ talks later today)
Getting Clarification - Metadata details about variables can be provided as attributes • cdat takes advantage of netcdf’s metadata capabilities. • the MV2 module provides masked value (NaN) support. Each dimension is associated with an axis with its own attributes bounds can be specified to clarify whether axis values denote the beginning, center, or end of an interval. It is easy to manipulate masked data
Aligning Data - cdtime Datasets use a variety of time conventions (e.g. no-leap year, 360 day calendar, Gregorian,…) This is a huge issue for intercomparisons convert axes data to human-readable format find the index of a time of interest subset data without worrying about calendar
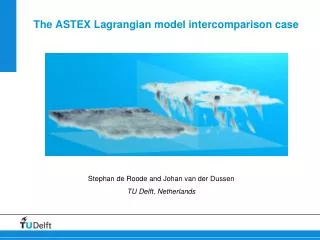
Aligning Data - Regridding WRF–NARR DJF Zonal Moisture Flux Difference 54 48 42 36 30 24 18 -138 -132 -126 -120 -114 -108 -102 Vertically-Integrated Flux (kg m-2m s-1) -55 -35 -15 0 15 35 55 For rectangular grids Scrip - For irregular grids Make netcdf files w/ original and target grid data Update control file to point to these grids Run scrip executable to generate and save weights In cdat, read in weights and use to create a regrid function using regrid2.readRegridder Apply the new regrid function to the desired data.
Handling Big Datasets - Tricks Large datasets mire computations and cause memory crashes. • data size issues are traditionally handled by breaking data into chunks, but looping over chunks in python is slow (typical of high-level languages) and not always possible. • Writing loops in C or F90 and importing as python modules is easy (more on next slide) • If only a subset of a variable from a file is needed, smart extraction (e.g. f(‘x’,time=(‘1990-1-1’,’2000-1-1’), latitude=…) ) avoids writing the whole variable into memory. • Smart extraction on indices uses “slice” (e.g. f(‘x’,time=slice(10,20)) ) • Data can be accessed directly from the file instead of writing a local copy by using f[‘x’] instead of f(‘x’)… but be careful of overwriting file data!
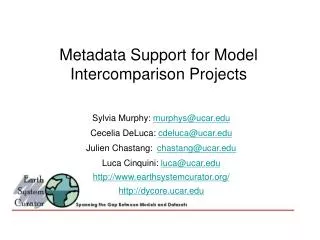
Writing Hybrid C/F90/Python Code Option 1: f2py – for easy-to-compile things Make F90 subroutine generate F90-python interface file (.pyf) make shared object library (.so) >>> import my_mod >>> my_mod.squared(2.) 4.0 in cdat, import and use module Figure created by using f2py to run old and new CAM5 cloud fraction parameterizations in offline mode
Writing Hybrid C/F90/Python Code Option 2: ctypes – for code with a complicated makefile ctypes is not friendly. Make a python wrapper for it. Same F90 subroutine Pass “-shared” to create a shared object (.so) library gfortran -shared -olibMyCode.so MyF.F90 load library I used ctypes to imple-mentrrtmg radiation in cdat, allowing for easy testing of radiative effects. Initialize output only ctypes objects can be passed use shell command “nm libMyCode.so” to get subroutine name
Parallel Data Processing - ipython • In a terminal window, start 4 python instances: ipcluster local -xy -n4 • In another window, call a parallelized script: Example: parallel statistical estimate of pi π=4*ratio of areas of unit circle to unit square Task farming is most obvious for data processing, but MPI parallelism is also possible.
Manipulating Data Lots of options: numpy + scipy are included in cdat, any python code from the web can be added. • Some cdat-specific features: • genutil.averager – smart area-weighted (lat,lon) averages • cdutil.vertical – convert from hybrid sigma vertical coordinates to pressure levels Precip power spectra using code from code.activestate.com/lists/python-list/316743/
Visualization vcs (part of cdat) is great for maps and animations The xmgrace module makes nice line plots matplotlib is the most full-featured (and my current favorite)
Wrap-up: This is just the tip of the iceberg. For more, see http://www2-pcmdi.llnl.gov/cdat