Download
1 / 2
20 likes | 183 Views
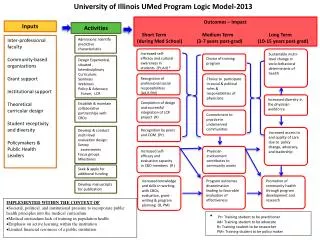
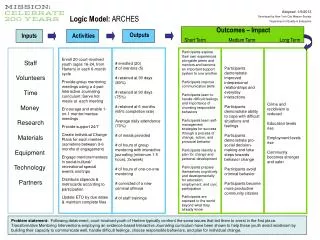
CTC Chinook Model Calibration. Calibration Objective: Estimate the set of stock and brood specific EVs that produce an identical set of Escapement/terminal runs compared to the observed escapement/terminal runs for 30 CTC stocks. Calibration Process ** Diagram. Key Calibration Inputs.

E N D
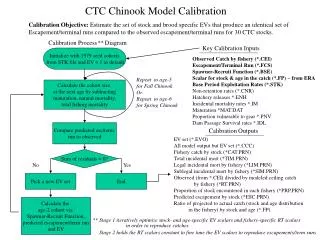
CTC Chinook Model Calibration Calibration Objective: Estimate the set of stock and brood specific EVs that produce an identical set of Escapement/terminal runs compared to the observed escapement/terminal runs for 30 CTC stocks. Calibration Process** Diagram Key Calibration Inputs Initialize with 1979 seed cohorts from STK file and EV = 1 as default Observed Catch by fishery (*.CEI) Escapement/Terminal Run (*.FCS) Spawner-Recruit Function (*.BSE) Scalar for stock & age in the catch (*.FP) – from ERA Base Period Exploitation Rates (*.STK) Non-retention rates (*.CNR) Hatchery releases *.ENH Incidental mortality rates *.IM Maturation *MAT.DAT Proportion vulnerable to gear *.PNV Dam Passage Survival rates *.IDL Repeat to age-5 for Fall Chinook Or Repeat to age-6 for Spring Chinook Calculate the cohort size at the next age by subtracting maturation, natural mortality, total fishing mortality Compare predicted esc/term run to observed Calibration Outputs EV set (*.EVO) All model output but EV set (*.CCC) Fishery catch by stock (*CAT.PRN) Total incidental mort (*TIM.PRN) Legal incidental mort by fishery (*LIM.PRN) Sublegal incidental mort by fishery (*SIM.PRN) Observed (from *.CEI) divided by modeled ceiling catch by fishery (*RT.PRN) Proportion of stock encountered in each fishery (*PRP.PRN) Predicted escapement by stock (*ESC.PRN) Ratio of projected to actual catch (stock and age distribution in the fishery) by stock and age (*.FP) Sum of residuals = 0? No Yes Pick a new EV set End Calculate the age-2 cohort via Spawner-Recruit Function, predicted escapement/term run and EV ** Stage 1 iteratively optimize stock- and age-specific EV scalars and fishery-specific RT scalars in order to reproduce catches Stage 2 holds the RT scalars constant to fine tune the EV scalars to reproduce escapements/term runs
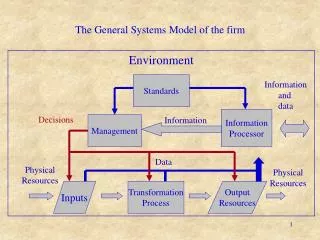
CTC Chinook Model Projection Projection Objective: Project the pre-season total allowable landed catch for the SEAK, NBC, and WCVI AABM fisheries CTC Model Base period stock abundances & calibrated EVs for all years AABM Base Period & 2006 Abundances Calculate SEAK, NBC, and WCVI Abundance Index (AI) Spawner Recruit Curves Aggregate the stock abundances for the AABM fisheries for all calendar years AABM AI catch look-up table and function Ocean age-2 cohort Calculate age specific cohort (a+1) abundance by subtracting projected catch (cohort * BPER * FP * RT) and natural mortalities from cohort (a) for all brood years SEAK, NBC, and WCVI Total Allowable Landed Catch Base period exploitation rates (BPER) and calibrated Catch Scalars (FP & RT) for all years