Download
1 / 17
170 likes | 332 Views
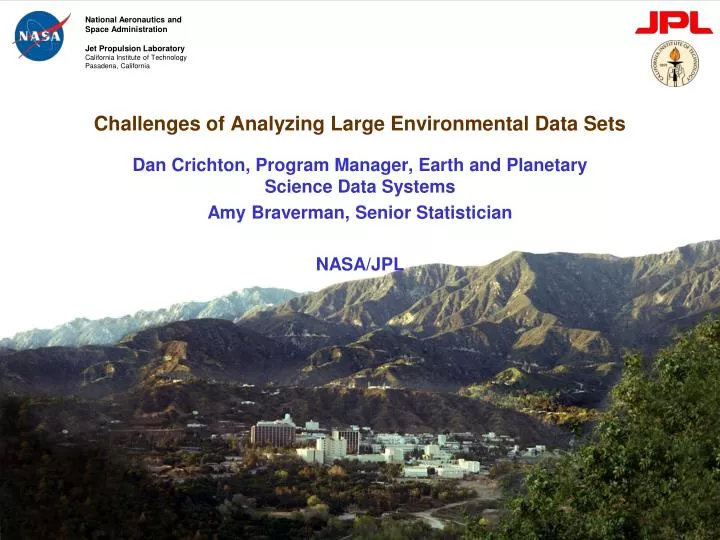
Challenges of Analyzing Large Environmental Data Sets. Dan Crichton, Program Manager, Earth and Planetary Science Data Systems Amy Braverman, Senior Statistician NASA/JPL. Massive Data Sets in the Environmental Sciences . Environmental science areas (not exhaustive):

E N D
Challenges of Analyzing Large Environmental Data Sets Dan Crichton, Program Manager, Earth and Planetary Science Data Systems Amy Braverman, Senior Statistician NASA/JPL
Massive Data Sets in the Environmental Sciences • Environmental science areas (not exhaustive): • Climate change science/climate modeling • Global • Regional • Environmental quality • Pollution • Epidemiology • Land use and natural resource management • Decision support and disaster management • Climate change impacts • Policy decisions and treaty enforcement • Disaster response (flooding, drought, volcanoes, etc.)
Massive Data Sets in Climate Science • Climate model output: • originally intended as laboratory experiments to play “what if” (explore the physics by twiddling knobs and seeing what happens) • now have greater policy implications wrt predictions into the future, attribution of causes, and characterizing uncertainties • Observations: • Improve process understanding and formulate hypotheses through exploratory data analysis • Improve parameterizations (statistical description of sub-grid-scale processes) • Establishment of long term data records • Model evaluation • comparison of model output against observations • weighting multi-model ensemble members
Architecture Drivers: Data Intensive Science • Increasing data volumes requiring new approaches for data production, validation, processing, discovery and data transfer/distribution (E.g., scalability relative to available resources) • Roughly doubling in size every two years • Shift from compute to data intensive • Increased emphasis on usability of the data (E.g., discovery, access and analysis) • Increasing diversity of data sets and complexity for integrating across missions/experiments (E.g., common information model for describing the data) • the benefits to science in bringing together and creating “fused” data products from multiple sources is critical in areas such as climatology where baseline data records are needed across measurements ** • Increasing distribution of coordinated processing, operations and analysis (E.g., federation) • On the fly analysis • Increased pressure to reduce cost of supporting new missions • Increasing desire for PIs to have integrated tool sets to work with data products with their own environments (E.g. perform their own generation and distribution)
NASA Earth Science Data Pipeline Science Teams Outreach Research On Board Processing TDRS Network Mission Operations Mission Operations Science Data Processing L0B L1L2 L3 L4 Science Data Processing L0B L1L2 L3 L4 Science Data Management Archive & Distribution Science Data Processing L0B L1L2 L3 L4 Science Data Management Archive & Distribution Science Data Management Archive & Distribution Data Acquisition and Command Instrument Operations Instrument Operations Instrument Operations L0A Processing L0A Processing L0A Processing EDOS/Ground Data Systems EDOS/GDS Science Data Systems SDS EOSDIS DAAC EDOS/GDS SDS EOSDIS DAAC EOSDIS Data Centers
EOSDIS DAAC’sEarth Observing System Data and Information System Distributed Active Archive Centers
Using Satellite Observations to Enable Climate Model Evaluation How to bring as much observational scrutiny as possible to the IPCC process? How to best utilize the wealth of NASA Earth observations for the IPCC process? Next Target : IPCC AR5 Model Output Available for Analysis Spring 2011 Papers Due ~ Late 2011/Early 2012 Report Completion 2013
Earth System Grid Federation • DOE-funded federation to distribute climate model output to the climate modeling community • Common services for access to repositories and portals/gateways • Highly decoupled • Open source framework (software packaged and distributed) mandated by DOE SciDAC Program • A Recent question….how do you link observations and climate model output?
Moving to Data Intensive Science • Traditional Pipelines vs. Online Dynamic Services • Convergence between static pipelines and “on-the-fly” data processing and services • Analysis of Distributed Data through Distributed Computational Services • Push computational services to data • Fused Data Products • Generate new, fused data products • Virtual Research Networks • Provide a computing infrastructure for collaborative research
Traditional Analysis Approach Credit: Braverman, Mattmann, Crichton • User program must encode all functionality beyond gross-level access. • Requires knowledge of specific instrument characteristics such as retrieval methods, format, measurement error characteristics and biases, etc. • Difficulties multiply with more than one data source.
Emerging Paradigm for Analysis Credit: Braverman, Mattmann, Crichton • Push as much computation as possible to locations where the data reside; minimize data movement • Deploy simple services to data centers that provide access and the computational functions to enable model-to-data analysis • Embrace service-oriented style of architecture
Data Integration • Combining AIRS and MLS requires: • Rectifying horizontal, vertical and temporal mismatch • Assessing and correcting for the instruments’ scene-specific error characteristics (see left diagram)
Model Intercomparison: Regional Example Collect User Choices (GUI / command line) Observations Model file Retrieve obs from database Load model data e.g. map, time series plot, Taylor diagram e.g. calculate means of all Januarys, all Februarys etc e.g. calculate bias, RMS error etc e.g. calculate area-weighted mean over user defined masked region e.g. calculate monthly means from daily data Spatial re-gridding onto common grid Time averaging optional Area -averaging RCMET Annual cycle compositing Metric Calculation Plot production
Computational Vision On Board Processing Science Teams TDRS Network Research Science Data Processing Network w/ Cloud Storage & Computation NASA Mission/Multi-Mission Data & Science Centers NASA Mission/Multi-Mission Data & Science Centers NASA Mission/Multi-Mission Data & Science Centers Science Data Manage Science Data Manage Science Data Manage Mission Operations Mission Operations Analysis, Modeling and Application Environments/Gateways Data Acquisition and Command Instrument Operations Instrument Operations Applications Instrument Operations L0A Processing L0A Processing L0A Processing Decision Support EDOS/Ground Data Systems EDOS/GDS EDOS/GDS Other Data Systems (e.g. NOAA) Other Data Systems (e.g. NOAA) Other Data Systems (e.g. NOAA)
Research Challenges for Statistics • What architectural design produces the most efficient system topology for the types of data movement that will be required given scientific objectives? Can we study this as an optimization problem? • How do we design computational methods that exploit the system topology and its distributed nature? Need algorithms that operate on distributed data to produce statistics of interest, or approximations. Study this trade-off. • Data analysis choreography: how to assemble algorithms most efficiently given a set of analysis goals? How to optimize the movement of data? • How can statistics and other disciplines (e.g., computer science) education be better aligned?
Summary • Significant efficiencies may be achieved by thinking of data analysis and data access together rather than thinking of them as serial operations. • In this paradigm, data sets are not static entities. They are virtual, possibly streaming data structures flowing across the internet, manipulated and combined on-the-fly as necessary for specific analyses. • We need new statistical methods and algorithms optimized for this type of environment.