Download
1 / 33
330 likes | 467 Views
Anomalous Reintensification of (Sub)Tropical Storm Allison (2001) over Land. Kwan-yin Kong and Stanley David Gedzelman EAS Department and NOAA CREST Center City College of New York. Seminar Outline 1. Allison’s Legacy 2. Classical Hurricane Structure 3. IR Satellite Imagery

E N D
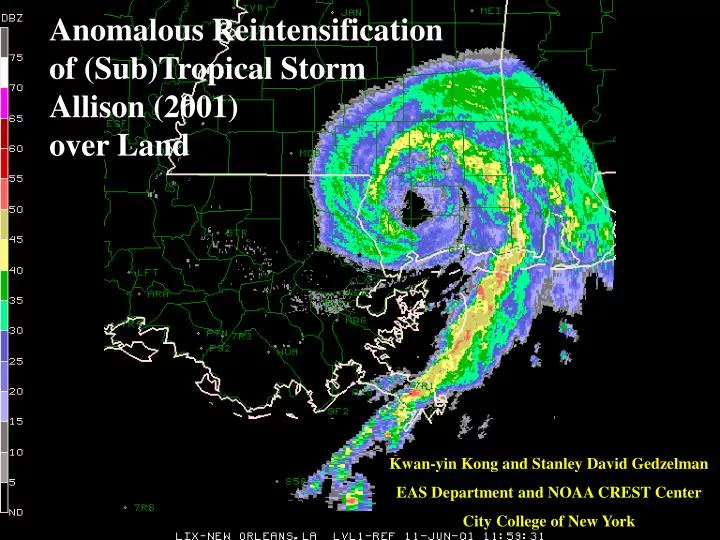
Anomalous Reintensification of (Sub)Tropical Storm Allison (2001) over Land Kwan-yin Kong and Stanley David Gedzelman EAS Department and NOAA CREST Center City College of New York
Seminar Outline 1. Allison’s Legacy 2. Classical Hurricane Structure 3. IR Satellite Imagery 4. Radar Imagery 5. Structure and Evolution 6. Causes of Intensification 7. MM5 Simulations
Allison’s Legacy Allison (2001) was a weak, mostly disorganized system that twice reached Tropical Storm Status. It formed over the Gulf of Mexico just south of Houston on 04 June. On 06 June Allison moved inland over Houston, where it produced up to 80 cm of rain in 5 days. It then moved back over the Gulf and wandered eastward, making a second landfall shortly after 00 UTC on 11 June. From 00 to 12 UTC on the 11th, Allison intensified and became more organized. It developed a squall line or rain band on its eastern side that wrapped around the center to produce a feature that resembled an eye. Rain began in southern Louisiana and Mississippi days before landfall there, transforming the lowlands into a watery world. This may have contributed to the post landfall intensification. Here we analyze Allison and use MM5 simulations to help diagnose its anomalous intensification over land.
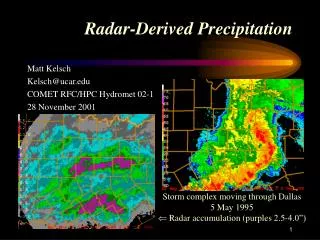
Track of Allison (2001) Swamp-fall 0400 UTC 11 June
Sequence of Radar Charts Features 1. Convective lines form around 0200 and 0800 to SE of center. 2. Second line wraps around center to encircle eyelike feature. 3. Dry slot advected around southern side of storm
Major Causes of Tropical Cyclone Intensification 1. Warm water eddy Opal (1995), Bret (1999) 2. Vorticity advection aloft David (1979) 3. Increasing baroclinicity Hazel (1953) 4. Convective bursts in Eye Wall. Hortense (1996)
MM5 Simulations Offer choice of resolution + several parameterizations each for 1. Cloud Microphysics (mPH) 2. Convective Adjustment (CNV) 3. Boundary Layer Dynamics (BDL) Results: Runs not very sensitive to mPH. Only the combination of Grell CNV + MRF BDL captured the intensification. Higher resolution (15 km) produced inferior results! Adding more levels near tropopause moved Allison eastward faster (an improvement). Why??? Grell + MRF was the only combinaton to reproduce the convective burst that formed near the storm center - others produced competing convection far from center that never got entrained in the storm’s circulation . Grell + MRF also produced the greatest vapor flux convergence into the storm’s central region.
81km 27km Domain setup for Allison
Precipitation Cumulus PBL Anthes-Kuo Blackadar Warm rain Simple ice Grell Burk-Thompson Mixed-phase Arakawa-Suhubert Eta Goddard Fritsch-Chappell MRF Reisner-graupel Kain-Fritsch (KF) Gayno-Seaman (GS) Betts-Miller Schultz Pleim-Chang MM5 physics options
Actual track of Allison versus MM5 runs using Grell cumulus + five different PBL 536 532,533,534 535 435 L 12Z 6/12 L L 00Z 6/12 L L 12Z 6/11 L L L L 12Z 6/10 00Z 6/11
Features of the MM5 Simulation Aloft Pseudo-eye formation was due mainly to advection of dry air with a secondary contribution from sinking (5 - 10 cm s-1 at 300 hPa level). Simulated intensification and eye formation were linked but occurred several hours later than observations. Allison simulations did not contain a consistent warm core and did not contain a dry slot of sinking stratospheric air.
Next Allison MM5 Runs No MM5 run fully captured Allison’s deepening. Because SST’s were warmer than the MM5 analysis indicated and because so much rain converted the swampy lowlands to a largely watery world, we will try two more experiments 1. Warm SST’s north of 29 N to 299.8 K 2. Change the land use categories of several pixels to water. Nocturnal intensification may have been aided by thermal inertia of flooded land.
299.8 Buoys 299.9 299.8 MM5 Sea Surface Temperature Analysis 10-13 June 2001
Conclusions The most exciting result is that MM5 was able to capture some critical features of Allison’s evolution and intensification over land, adding strong evidence to the finding that intensification of tropical cyclones often follows flareups of convection in or near the eye wall that get swirled around the storm to form a more symmetric and steady but often less convective eyewall.