Download
1 / 21
210 likes | 218 Views
assignment (15). assignment (16). next topic. errors and uncertainties in measurement combining errors/uncertainties

E N D
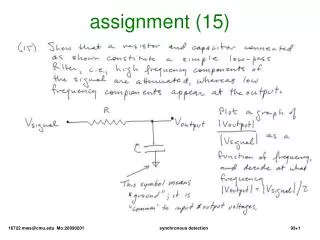
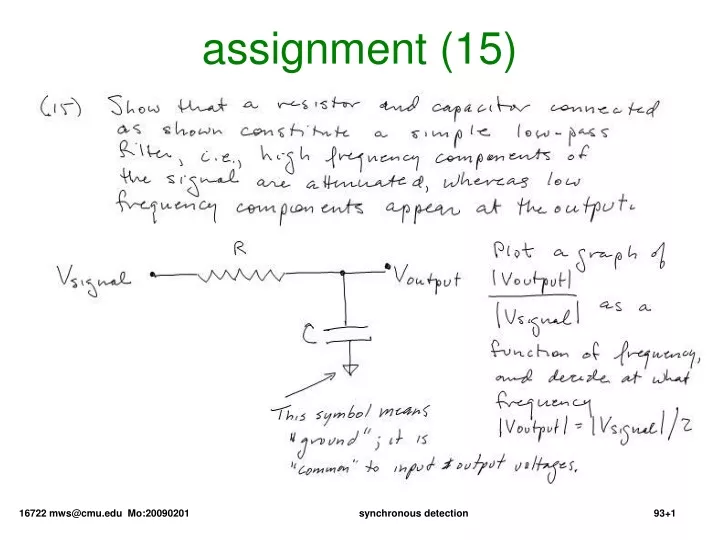
assignment (15) synchronous detection
assignment (16) synchronous detection
measurements & distributions next topic ... • errors and uncertainties in measurement • combining errors/uncertainties • to find the net error/uncertainty in a quantity calculated from several component measurements, assuming you know the individual error/uncertainty in each component (error propagation) • to find the net error/uncertainty you can realize if you make and combine several measurements of the same quantity, perhaps using different sensors, instruments, or sensing principles (sensor fusion)
measurements & distributions key points to take away ... • accuracy & precision of single measurements • combining errors/uncertainties • a result calculated from multiple different uncertain measurements must have a relative uncertainty worse than the worst component’s relative uncertainty • a result calculated from multiple uncertain measurements of the same measurand, e.g.,by making the measurement several times with different instruments, must have an absolute uncertainty better than the best individual measurement’s absolute uncertainty
measurements & distributions accuracy & precision • accuracy: how close is your measurement to the correct value? (whatever “correct” means ...) • precision: what is the spread of your measurements around the value you found?
measurements & distributions error & uncertainty • the difference between error & uncertainty is ...well ... that’s actually a little uncertain ... • generally “uncertainty” is used more-or-less interchangeably with the resolution of the measuring instrument ... • and error is used more-or-less interchangeably with the inaccuracy of the result • errors you can characterize by the statistical distribution of the measurements you actually make • errors you can only estimate, i.e., guess • fundamental arguments among mathematicians etc about whether the same arithmetic applies to both
measurements & distributions distribution of measurementswhose outcome is aninteger count
measurements & distributions measurements whose outcomes areinteger counts relativeprobability (1) you count many samples (2) you calculate the meanof the counts in your samples (3) what determines the width of this distribution of observed results? observed numberof counts
measurements & distributions assignment • (20) The World Series problem: a) Get ~100 years of outcomes of the World Series;http://www.baseball-almanac.com/ws/wsmenu.shtmlis one of many compilations on the web. • b) If the teams are equally matched then the probability of the series going 4, 5, 6, or 7 games is equivalent to coin flipping; plot actual outcomes vs. corresponding coin-flip probabilities. • c) Now compare the probabilities you calculated with the actual data. Does the series generally run shorter or longer than you would expect? What are some reasons actual and expected might differ?
assignment (17) more good words to think about:integrator ↔ averager or smoother differentiator ↔ edge or transition detector synchronous detection
synchronous detection summary, then details • narrow banding “squeezes out” noise but not signal • problem: to keep the system “on station” • lock-in amplifier (a.k.a. synchronous amplifier, synchronous rectifier, phase sensitive detector, etc) • stays “on station” because you have the reference signal • squeezes out noise in phase and frequency domains • generalization: some forms of modern spread spectrum communication coding, e.g., CDMA (code division multiple access) for GPS, cell phones, etc.
synchronous detection the concept expressed as code • ordinary passive “full-wave rectifier”: • Abs[signal(t)] = signal(t)>0 ? signal(t):-signal(t) • synchronous rectifier: • SyncAbs[signal(t), reference(t)] = reference(t)>0 ? signal(t):-signal(t) • reference(t) takes on many application- and economics-dependent forms: • multiply by cos(ωref t): typical analog modulation • on/off: typical mechanical or digital modulation • pseudo-random word: typical broadband system • CDMA cell phone communication • GPS satellite navigation system
synchronous detection graphical illustration (1) consider an illustrative “slowly varying” signalS[t] = 1.0 - 0.8t + 0.8t2 + 0.2 sin[4t]+0.025 cos[12t]
synchronous detection (2) now bury the signal in a much larger sea of noise:noise[t] = 2.+.4t-4.t2-.5Sin[4t+/6.] - .25Cos[12t-/12.] signal+noise signal
synchronous detection (3) when the signal (but not the noise) is modulated this is how the synchronous rectifier output looks: what you see (S+N) above what you would see if you ran this through an averaging algorithm (N) below notice that the average value (the solid line)faithfully reconstructs the original signal …now we need to actually implement the averaging
synchronous detection (4) here it is after processing by a 21-point sliding average: heavier filtering would faithfully restore the original signal, distorted (under favorable conditions only slightly) by the noise that happens to be in the frequency and phase band accepted by the process
synchronous detection summary … • if you can give your signal (but not the noise) some sort of “signature” you can pull it back out it of a lot of noise • if you chop or sinusoidally modulate it and use a detection method that looks for the modulation frequency you win nicely • if you use a detection method that looks for the modulation frequency and its phasethen you win spectacularly • more complex signatures, e.g., CDMA, provide even better noise rejection
synchronous detection assignment 18) The three major cell phone systems are CDMA, TDMA, and GSM. xDMA describes both the system and the coding method; GSM describes a system that uses a kind of “phase shift coding” (PSC). Identify (e.g., by web search) and document one service provider who uses each coding method. Briefly describe the essential idea underlying each coding method. [Note: you may find that they are not mutually exclusive, e.g., some systems use both PSC and TDMA. ]
synchronous detection last few topics we covered ... • basic transduction & measurement • sensors that deliver electronic signals • voltage sources & current sources • device parameters (resistance, capacitance, …) • force a voltage, measure the current • force a current, measure the voltage • mother nature’s efforts to thwart sensing • fundamental noise (thermal, shot, “flicker”) • technical noise (the environment) • some tricks to make the best of it • narrow banding in frequency domain • coding to narrow-band in phase domain
synchronous detection remember well ... • usually signal accumulates faster than noise • e.g., integrated signal power ~ measuring time integrated noise power ~ measuring time½so S:N ratio gets better as time½ • but not always! • e.g., in an inertial navigation system signal-to-noise ratio of a position measurement gets worse as time3/2
synchronous detection assignment 19) Numerically simulate a one-dimensional “integrated random walk”: you are in a sealed-cabin with an accelerometer; you know your starting position, and you start with zero velocity; integrating the accelerometer output gives your velocity, integrating again gives your displacement from initial position; but the accelerometer output has random noise on it. Show that your simulation suggests Δv ~ t1/2 and Δx ~ t3/2.