Download
1 / 6
60 likes | 223 Views
A. U28 snoRNA. U25 snoRNA. U26 snoRNA. U27 snoRNA. U22 snoRNA. U29 snoRNA. U30 snoRNA. U31 snoRNA. U22 snoRNA. Human. 25. 26. 27. 28. 22. 29. 30. 31. 22. Frog. 25. 28. 22. 30. 26. 31. 29. 27. 31. Fugu. 29. 25. 27. 30. 31. 26. 22. 31. 27. Zebrafish. 25. 26.

E N D
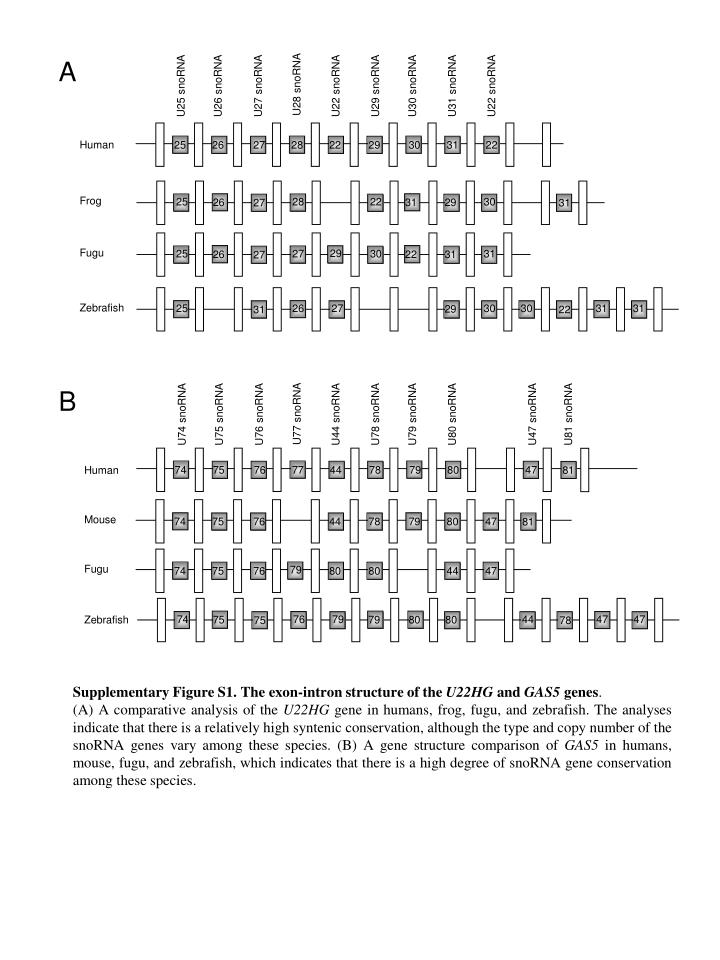
A U28 snoRNA U25 snoRNA U26 snoRNA U27 snoRNA U22 snoRNA U29 snoRNA U30 snoRNA U31 snoRNA U22 snoRNA Human 25 26 27 28 22 29 30 31 22 Frog 25 28 22 30 26 31 29 27 31 Fugu 29 25 27 30 31 26 22 31 27 Zebrafish 25 26 27 30 30 31 31 29 31 22 B U77 snoRNA U74 snoRNA U75 snoRNA U76 snoRNA U44 snoRNA U78 snoRNA U79 snoRNA U80 snoRNA U47 snoRNA U81 snoRNA 74 75 76 77 44 78 79 80 47 Human 81 Mouse 74 75 76 44 78 79 80 47 81 Fugu 79 74 75 76 80 80 44 47 74 76 79 47 47 44 Zebrafish 80 75 79 80 75 78 Supplementary Figure S1. The exon-intron structure of the U22HG and GAS5 genes. (A) A comparative analysis of the U22HG gene in humans, frog, fugu, and zebrafish. The analyses indicate that there is a relatively high syntenic conservation, although the type and copy number of the snoRNA genes vary among these species. (B) A gene structure comparison of GAS5 in humans, mouse, fugu, and zebrafish, which indicates that there is a high degree of snoRNA gene conservation among these species.
c1 c2 c3 c4 c5 c6 c7 c8 c9 GAAGAmGAmGAGUp y9 y8 y7 y6 y5 y4 y3 y2 y1 100 80 60 c6 Relative Abundance c7 y2 40 y6 c8 c3 y1 c5 y4 y7 y3 c9 y8 y5 y9 20 c2 c1 c4 y2 0 200 400 600 800 1000 m/z Supplementary Figure S2. CID analyses of the methylated fragment in the wild-type embryos. The CID spectrum of the A398 and A400 methylated fragment (GAAGAm398GAm400GAGUp) obtained from the wild-type embryos. The precursor ion was m/z 619.4 (z= -6). The Am398 site is underlined in the fragment sequence (inset). The product ion assignments are in agreement with Fig. 3B.
A WT U26MOpr 100 28S rRNA 394-404 100 GAAGAmGAmGAGUp(U26) MW 3722.567 m/z 1239.848 (z = -3) Relative Abundance GAAGAGAmGAGUp MW 3708.551 m/z 1235.176 (z = -3) 0 0 26 30 34 38 26 30 34 38 B min min 100 100 28S rRNA 3875-3887 GGGGmAAAGAAGACp(HBII-99) MW 4381.667m/z 729.270 (z = -6) Relative Abundance GGGGAAAGAAGACp MW 4367.652 m/z 726.934 (z = -6) 0 0 26 30 34 38 26 30 34 38 min min C 100 100 18S rRNA 1482-1490/1491 CAAUAACAGmGp(U25) MW 3283.491 m/z 1640.738 (z = -2) Relative Abundance CAAUAACAGp MW 2924.428 m/z 1461.206 (z = -2) 0 0 22 27 32 37 42 22 27 32 37 42 min min Supplementary Figure S3. LC/MS analyses of rRNAs from the U26MOprmorphants. Mass chromatograms of RNase A-digested 28S rRNA (A, B) or RNase T1-digested 18S rRNA fragments (C) from the wild-type embryos (left panels) and the U26MOprmorphants (right panels). The U26MOprmorphants show an accumulation of the A398-unmethylated fragment (A), similar to the U26MOspmorphants (Fig. 2A), whereas analyses of other snoRNA-guided modification sites (B, C) did not show any accumulation of unmethylated fragments in these morphants. The representations here are the same as in Fig.2.
WT U78misMOsp U26misMOsp U26misMOpr U44misMOsp U44misMOpr Supplementary Figure S4. Morphology of the mismatch MO-injected embryos. A lateral view of the wild-type and misMOsp or misMOpr (control MO)-injected embryos at 25-27 hpf. The embryos injected with control MOs for the respective snoRNA genes are morphologically identical to the wild-type embryos. Scale bar: 500 mm.
WT U78MOsp Supplementary Figure S5. A close-up image of the U78 morphant head region. The U78MOsp-injected embryos show a malformed 4th ventricle (curved line), but do not have any other obvious defects in other parts of the brain compared with the wild-type embryos. Scale bar: 200 mm. 30 hpf
U44misMOpr U44MOsp U44MOpr WT 237 bp 67 bp Actin Supplementary Figure S6. Semi-quantitativeRT-PCR analysis of gas5 transcript level relative to actin in U44MO (MOsp and MOsp), control, and WT embryos. The improperly spliced gas5 transcript (237 bp including intron 10) is increased only in U44MOsp morphants, compared with the normal gas5 transcript (67 bp without intron 10) in WT and control (U44misMOpr) embryos. 10 11 44 10 11